
- Start >
- Rivers >
- Waterlevel >
- Bayern >
- Goldbach >
- Chart of total period

Chart of total period Goldbach / Aschaff
Waterlevel from 01.11.1969 to 25.04.2024
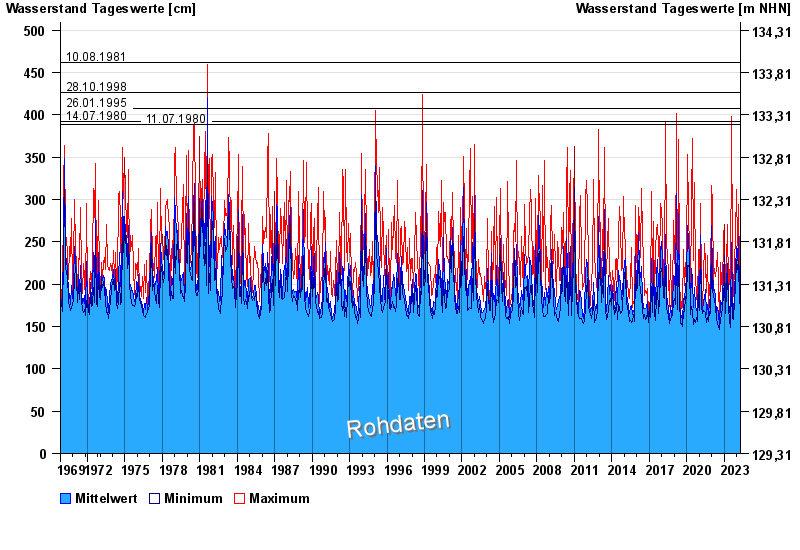
- 10.08.1981 Wasserstand: 462 cm
- 28.10.1998 Wasserstand: 426 cm
- 26.01.1995 Wasserstand: 407 cm
- 14.07.1980 Wasserstand: 392 cm
- 11.07.1980 Wasserstand: 389 cm
| Date | Mean value [cm] | Maximum [cm] | Minimum [cm] |
|---|---|---|---|
| 25.04.2024 | 183 | 186 | 182 |
| 24.04.2024 | 183 | 187 | 179 |
| 23.04.2024 | 180 | 184 | 178 |
| 22.04.2024 | 183 | 185 | 179 |
| 21.04.2024 | 191 | 199 | 181 |
| 20.04.2024 | 187 | 201 | 181 |
| 19.04.2024 | 196 | 237 | 170 |
© Bayerisches Landesamt für Umwelt 2024