
- Start >
- Rivers >
- Waterlevel >
- Bayern >
- Gampelmühle >
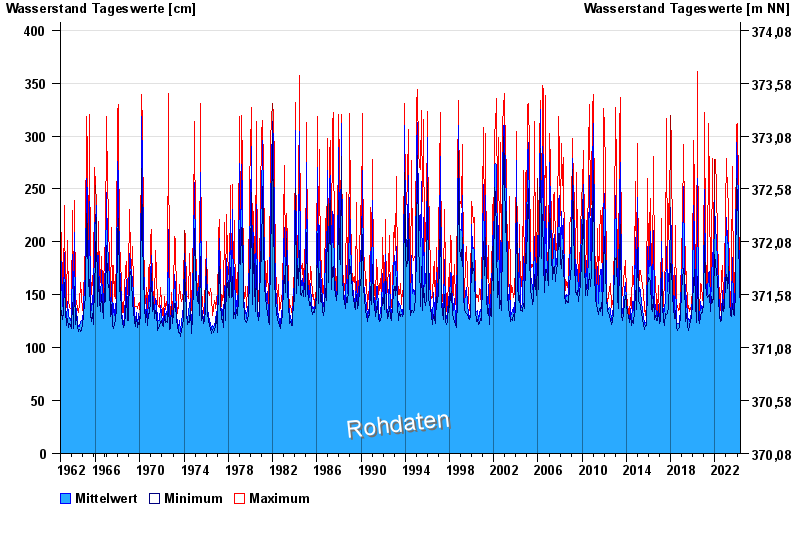
- Chart of total period

Chart of total period Gampelmühle / Ölschnitz
Waterlevel from 29.10.1962 to 24.04.2024
| Date | Mean value [cm] | Maximum [cm] | Minimum [cm] |
|---|---|---|---|
| 24.04.2024 | 154 | 155 | 153 |
| 23.04.2024 | 160 | 166 | 156 |
| 22.04.2024 | 175 | 199 | 163 |
| 21.04.2024 | 181 | 221 | 147 |
| 20.04.2024 | 151 | 156 | 148 |
| 19.04.2024 | 143 | 155 | 138 |
| 18.04.2024 | 141 | 143 | 139 |
© Bayerisches Landesamt für Umwelt 2024