
- Start >
- Rivers >
- Waterlevel >
- Bayern >
- Füssen >
- Chart of total period

Chart of total period Füssen / Lech
Waterlevel from 01.11.1963 to 20.04.2024
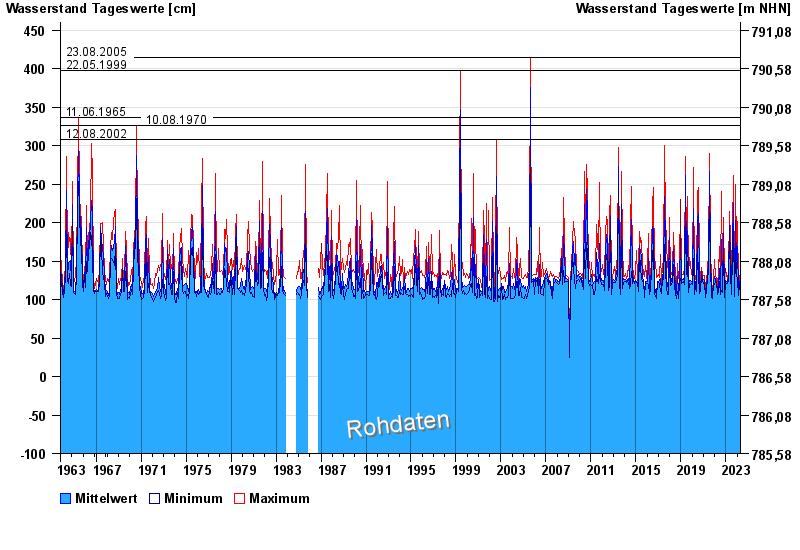
- 23.08.2005 Wasserstand: 415 cm
- 22.05.1999 Wasserstand: 397 cm
- 11.06.1965 Wasserstand: 337 cm
- 10.08.1970 Wasserstand: 326 cm
- 12.08.2002 Wasserstand: 308 cm
| Date | Mean value [cm] | Maximum [cm] | Minimum [cm] |
|---|---|---|---|
| 20.04.2024 | 105 | 106 | 104 |
| 19.04.2024 | 107 | 111 | 101 |
| 18.04.2024 | 109 | 120 | 102 |
| 17.04.2024 | 113 | 119 | 105 |
| 16.04.2024 | 125 | 135 | 114 |
| 15.04.2024 | 122 | 131 | 103 |
| 14.04.2024 | 114 | 126 | 109 |
© Bayerisches Landesamt für Umwelt 2024