
- Start >
- Rivers >
- Waterlevel >
- Bayern >
- Fürsteneck >
- Chart of total period

Chart of total period Fürsteneck / Wolfsteiner Ohe
Waterlevel from 01.11.1969 to 25.04.2024
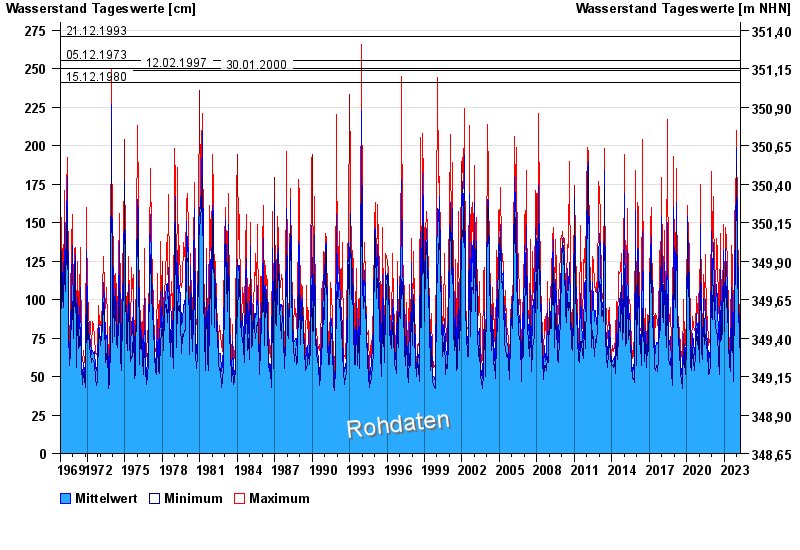
- 21.12.1993 Wasserstand: 271 cm
- 05.12.1973 Wasserstand: 255 cm
- 12.02.1997 Wasserstand: 250 cm
- 30.01.2000 Wasserstand: 249 cm
- 15.12.1980 Wasserstand: 241 cm
| Date | Mean value [cm] | Maximum [cm] | Minimum [cm] |
|---|---|---|---|
| 25.04.2024 | 63 | 64 | 63 |
| 24.04.2024 | 64 | 66 | 59 |
| 23.04.2024 | 65 | 67 | 63 |
| 22.04.2024 | 69 | 72 | 66 |
| 21.04.2024 | 76 | 84 | 71 |
| 20.04.2024 | 88 | 91 | 84 |
| 19.04.2024 | 68 | 88 | 63 |
© Bayerisches Landesamt für Umwelt 2024