
- Start >
- Rivers >
- Waterlevel >
- Bayern >
- Ettleben >
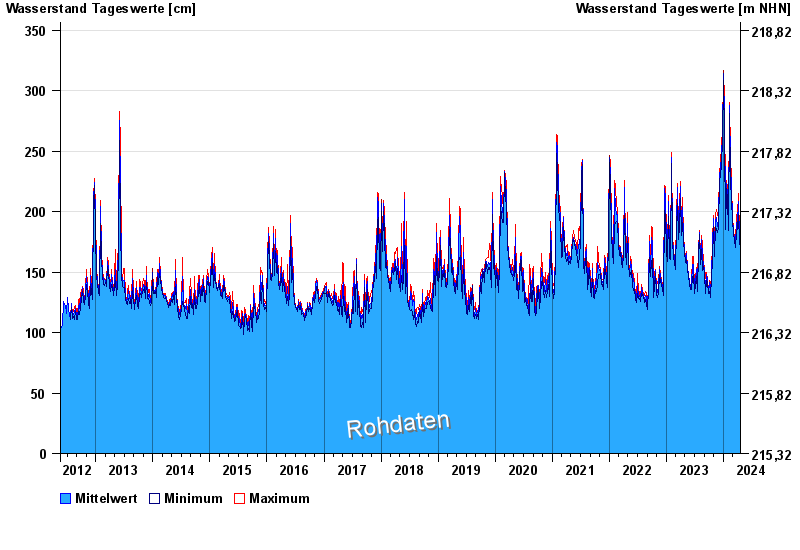
- Chart of total period

Chart of total period Ettleben / Wern
Waterlevel from 19.05.2012 to 20.04.2024
| Date | Mean value [cm] | Maximum [cm] | Minimum [cm] |
|---|---|---|---|
| 20.04.2024 | 182 | 182 | 181 |
| 19.04.2024 | 168 | 181 | 164 |
| 18.04.2024 | 170 | 173 | 167 |
| 17.04.2024 | 176 | 179 | 173 |
| 16.04.2024 | 166 | 173 | 164 |
| 15.04.2024 | 164 | 166 | 163 |
| 14.04.2024 | 164 | 165 | 163 |
© Bayerisches Landesamt für Umwelt 2024