
- Start >
- Rivers >
- Waterlevel >
- Bayern >
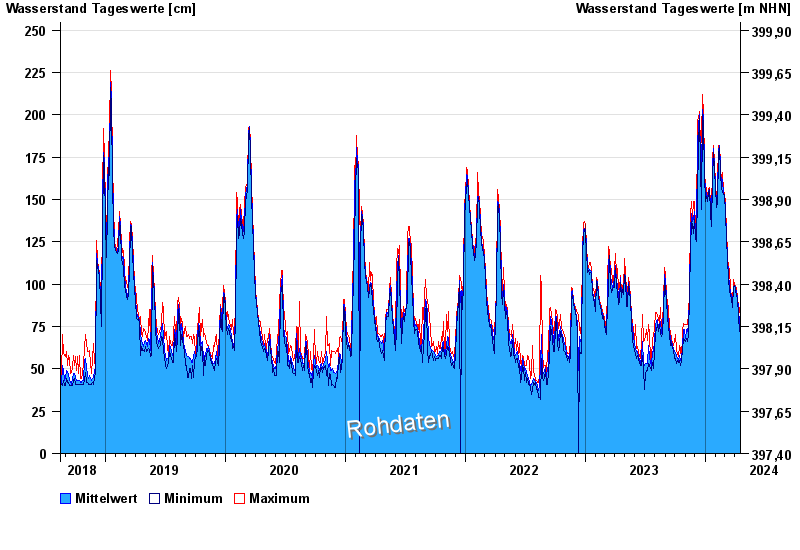
- Eßlingen >
- Chart of total period

Chart of total period Eßlingen / Altmühl
Waterlevel from 16.08.2018 to 17.04.2024
| Date | Mean value [cm] | Maximum [cm] | Minimum [cm] |
|---|---|---|---|
| 17.04.2024 | 76 | 77 | 76 |
| 16.04.2024 | 76 | 86 | 56 |
| 15.04.2024 | 76 | 78 | 72 |
| 14.04.2024 | 77 | 78 | 70 |
| 13.04.2024 | 79 | 81 | 76 |
| 12.04.2024 | 81 | 84 | 78 |
| 11.04.2024 | 85 | 87 | 81 |
© Bayerisches Landesamt für Umwelt 2024