
- Start >
- Rivers >
- Waterlevel >
- Bayern >
- Erlau >
- Chart of total period

Chart of total period Erlau / Donau
Waterlevel from 01.11.1970 to 25.04.2024
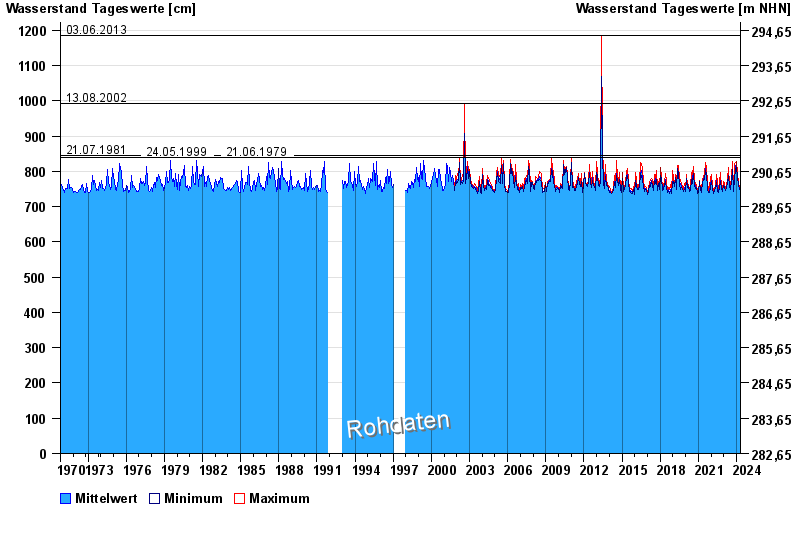
- 03.06.2013 Wasserstand: 1186 cm
- 13.08.2002 Wasserstand: 992 cm
- 21.07.1981 Wasserstand: 845 cm
- 24.05.1999 Wasserstand: 840 cm
- 21.06.1979 Wasserstand: 840 cm
| Date | Mean value [cm] | Maximum [cm] | Minimum [cm] |
|---|---|---|---|
| 25.04.2024 | 749 | 751 | 744 |
| 24.04.2024 | 751 | 753 | 748 |
| 23.04.2024 | 753 | 756 | 749 |
| 22.04.2024 | 754 | 757 | 751 |
| 21.04.2024 | 754 | 756 | 751 |
| 20.04.2024 | 754 | 756 | 750 |
| 19.04.2024 | 754 | 755 | 751 |
© Bayerisches Landesamt für Umwelt 2024