
- Start >
- Rivers >
- Waterlevel >
- Bayern >
- Erbendorf >
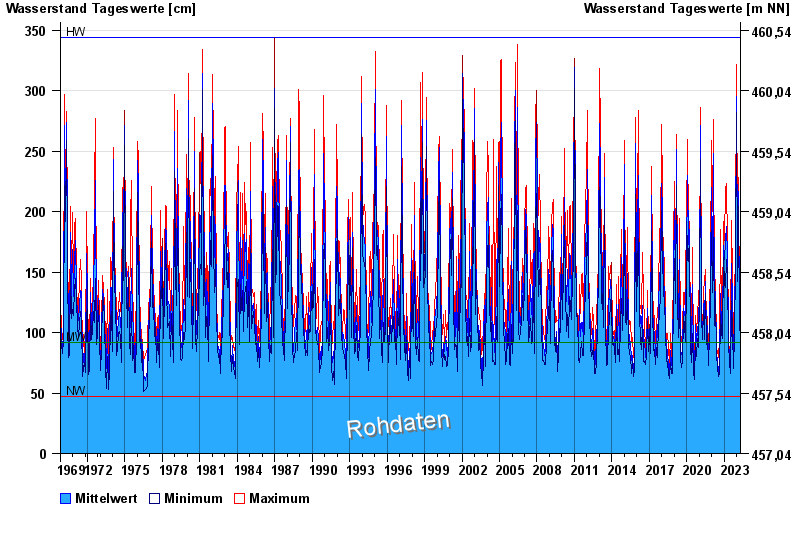
- Chart of total period

Chart of total period Erbendorf / Fichtelnaab
Waterlevel from 01.11.1969 to 20.04.2024
| Date | Mean value [cm] | Maximum [cm] | Minimum [cm] |
|---|---|---|---|
| 20.04.2024 | 119 | 121 | 116 |
| 19.04.2024 | 88 | 115 | 74 |
| 18.04.2024 | 85 | 88 | 80 |
| 17.04.2024 | 92 | 97 | 82 |
| 16.04.2024 | 83 | 95 | 77 |
| 15.04.2024 | 79 | 81 | 72 |
| 14.04.2024 | 79 | 81 | 79 |
© Bayerisches Landesamt für Umwelt 2024