
- Start >
- Rivers >
- Waterlevel >
- Bayern >
- Erb >
- Chart of total period

Chart of total period Erb / Leitzach
Waterlevel from 27.05.1940 to 19.04.2024
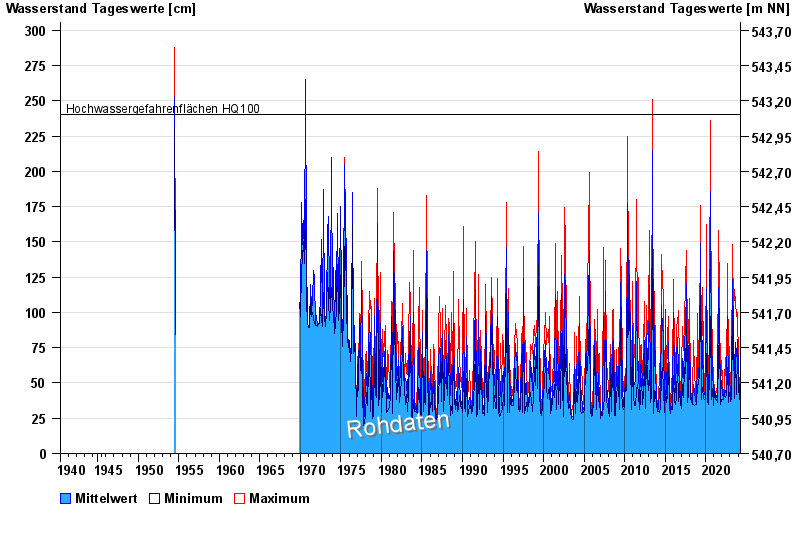
- Hochwassergefahrenfläche HQ100 240 cm
| Date | Mean value [cm] | Maximum [cm] | Minimum [cm] |
|---|---|---|---|
| 19.04.2024 | 36 | 36 | 36 |
| 18.04.2024 | 36 | 36 | 36 |
| 17.04.2024 | 36 | 36 | 35 |
| 16.04.2024 | 36 | 36 | 35 |
| 15.04.2024 | 36 | 36 | 35 |
| 14.04.2024 | 44 | 45 | 36 |
| 13.04.2024 | 40 | 45 | 35 |
© Bayerisches Landesamt für Umwelt 2024