
- Start >
- Rivers >
- Waterlevel >
- Bayern >
- Eching >
- Chart of year

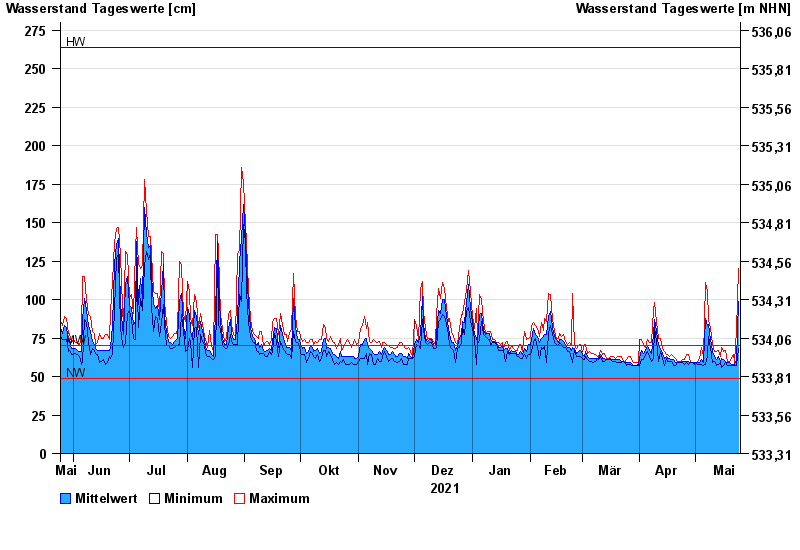
Chart of year Eching / Windach
Waterlevel from 25.05.2021 to 24.05.2022
note
Pegel beeinflusst durch Kraftwerkssteuerung
| Date | Mean value [cm] | Maximum [cm] | Minimum [cm] |
|---|---|---|---|
| 24.05.2022 | 99 | 120 | 68 |
| 23.05.2022 | 61 | 80 | 57 |
| 22.05.2022 | 58 | 59 | 57 |
| 21.05.2022 | 58 | 64 | 57 |
| 20.05.2022 | 58 | 62 | 57 |
| 19.05.2022 | 59 | 60 | 57 |
| 18.05.2022 | 59 | 60 | 57 |
© Bayerisches Landesamt für Umwelt 2024