
- Start >
- Rivers >
- Waterlevel >
- Bayern >
- Eching >
- Chart of year

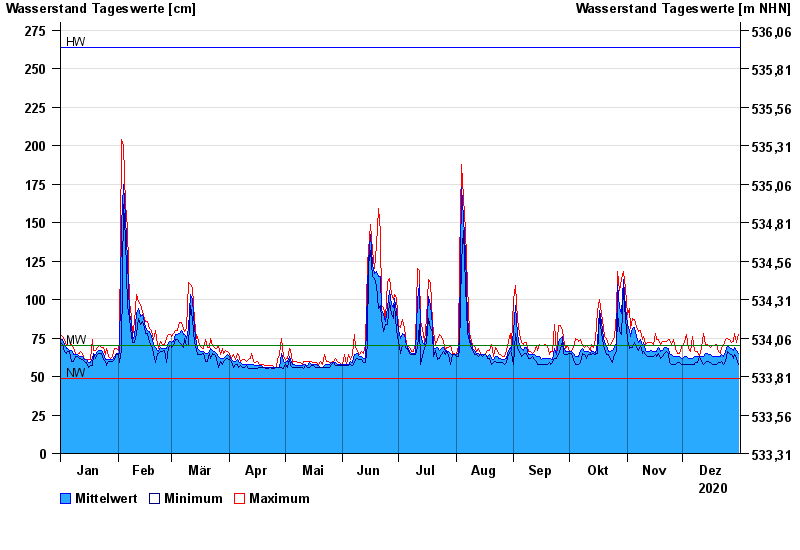
Chart of year Eching / Windach
Waterlevel from 01.01.2020 to 31.12.2020
note
Pegel beeinflusst durch Kraftwerkssteuerung
| Date | Mean value [cm] | Maximum [cm] | Minimum [cm] |
|---|---|---|---|
| 31.12.2020 | 65 | 77 | 58 |
| 30.12.2020 | 67 | 72 | 62 |
| 29.12.2020 | 69 | 78 | 64 |
| 28.12.2020 | 67 | 73 | 62 |
| 27.12.2020 | 68 | 72 | 64 |
| 26.12.2020 | 69 | 74 | 65 |
| 25.12.2020 | 70 | 75 | 66 |
© Bayerisches Landesamt für Umwelt 2024