
- Start >
- Rivers >
- Waterlevel >
- Bayern >
- Dobrigau >
- Chart of total period

Chart of total period Dobrigau / Wondreb
Waterlevel from 01.11.1972 to 24.04.2024
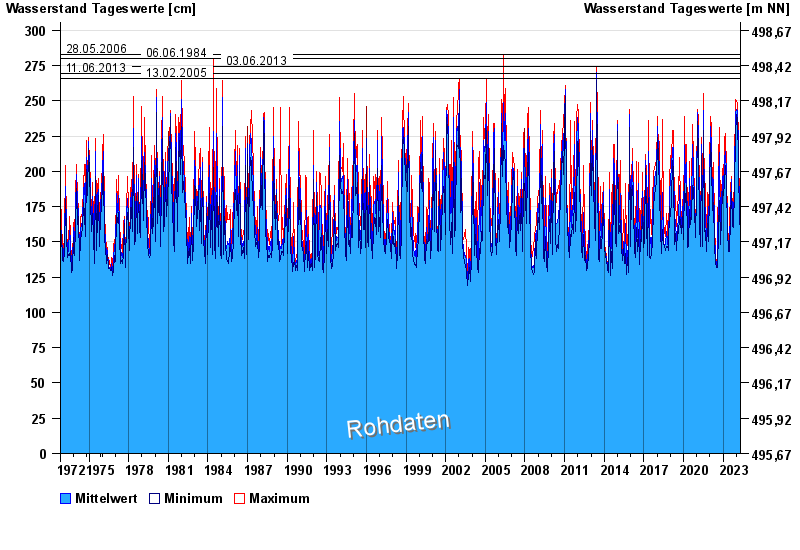
- 28.05.2006 Wasserstand: 283 cm
- 06.06.1984 Wasserstand: 280 cm
- 03.06.2013 Wasserstand: 274 cm
- 11.06.2013 Wasserstand: 269 cm
- 13.02.2005 Wasserstand: 266 cm
| Date | Mean value [cm] | Maximum [cm] | Minimum [cm] |
|---|---|---|---|
| 24.04.2024 | 166 | 167 | 165 |
| 23.04.2024 | 172 | 177 | 167 |
| 22.04.2024 | 180 | 187 | 175 |
| 21.04.2024 | 170 | 183 | 164 |
| 20.04.2024 | 165 | 170 | 158 |
| 19.04.2024 | 156 | 158 | 154 |
| 18.04.2024 | 157 | 159 | 156 |
© Bayerisches Landesamt für Umwelt 2024