
- Start >
- Rivers >
- Waterlevel >
- Bayern >
- Deggendorf >
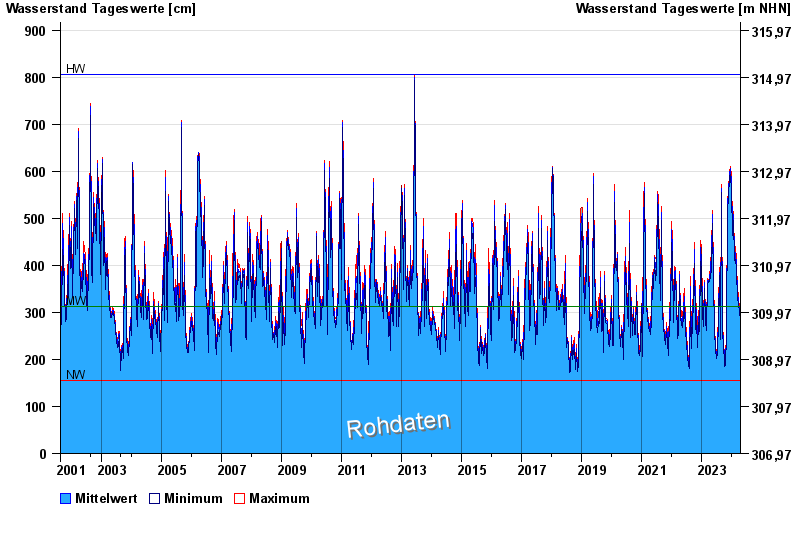
- Chart of total period

Chart of total period Deggendorf / Donau
Waterlevel from 16.08.2001 to 19.04.2024
| Date | Mean value [cm] | Maximum [cm] | Minimum [cm] |
|---|---|---|---|
| 19.04.2024 | 324 | 325 | 323 |
| 18.04.2024 | 314 | 322 | 310 |
| 17.04.2024 | 303 | 310 | 295 |
| 16.04.2024 | 290 | 299 | 282 |
| 15.04.2024 | 281 | 284 | 279 |
| 14.04.2024 | 278 | 282 | 274 |
| 13.04.2024 | 279 | 283 | 277 |
© Bayerisches Landesamt für Umwelt 2024