
- Start >
- Rivers >
- Waterlevel >
- Bayern >
- Bayreuth >
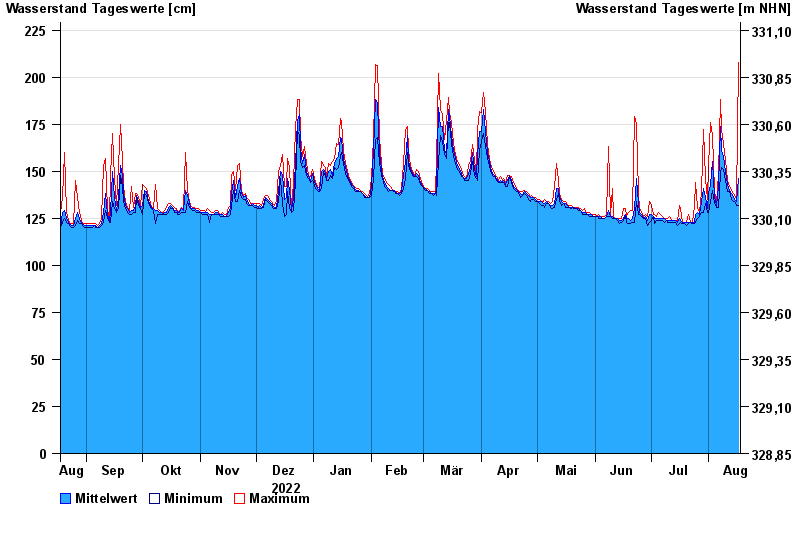
- Chart of year

Chart of year Bayreuth / Roter Main
Waterlevel from 18.08.2022 to 17.08.2023
- 26.01.1995 Wasserstand: 295 cm
- 06.06.1984 Wasserstand: 288 cm
- 15.06.1987 Wasserstand: 276 cm
- 21.12.1993 Wasserstand: 274 cm
- 13.01.2011 Wasserstand: 273 cm
| Date | Mean value [cm] | Maximum [cm] | Minimum [cm] |
|---|---|---|---|
| 17.08.2023 | 146 | 208 | 132 |
| 16.08.2023 | 134 | 135 | 132 |
| 15.08.2023 | 135 | 137 | 134 |
| 14.08.2023 | 136 | 138 | 134 |
| 13.08.2023 | 138 | 140 | 135 |
| 12.08.2023 | 140 | 142 | 139 |
| 11.08.2023 | 143 | 145 | 139 |
© Bayerisches Landesamt für Umwelt 2024