
- Start >
- Rivers >
- Waterlevel >
- Bayern >
- Bärenthal >
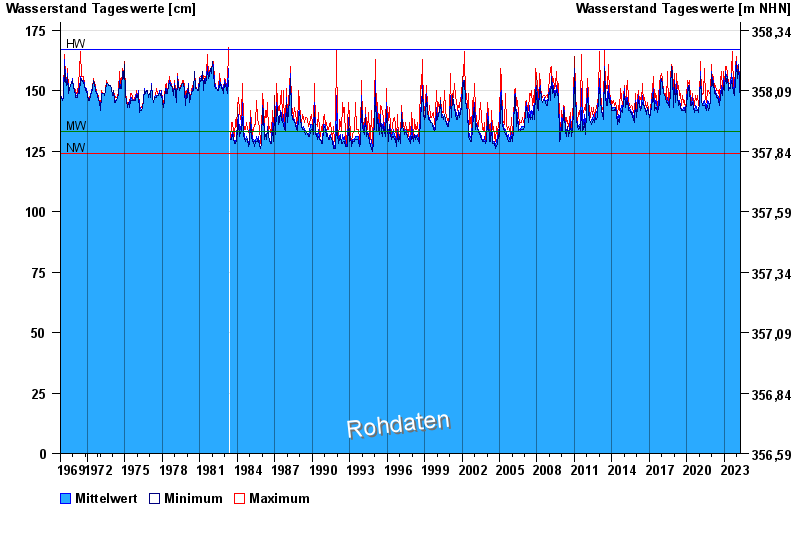
- Chart of total period

Chart of total period Bärenthal / Trubach
Waterlevel from 01.11.1969 to 19.04.2024
note
Absinken des Wasserstandes wegen Entfernung von Auflandungen.
| Date | Mean value [cm] | Maximum [cm] | Minimum [cm] |
|---|---|---|---|
| 19.04.2024 | 145 | 145 | 145 |
| 18.04.2024 | 145 | 146 | 144 |
| 17.04.2024 | 145 | 147 | 144 |
| 16.04.2024 | 146 | 147 | 145 |
| 15.04.2024 | 145 | 145 | 144 |
| 14.04.2024 | 144 | 146 | 143 |
| 13.04.2024 | 144 | 146 | 143 |
© Bayerisches Landesamt für Umwelt 2024