
- Start >
- Rivers >
- Waterlevel >
- Bayern >
- Bad Wiessee >
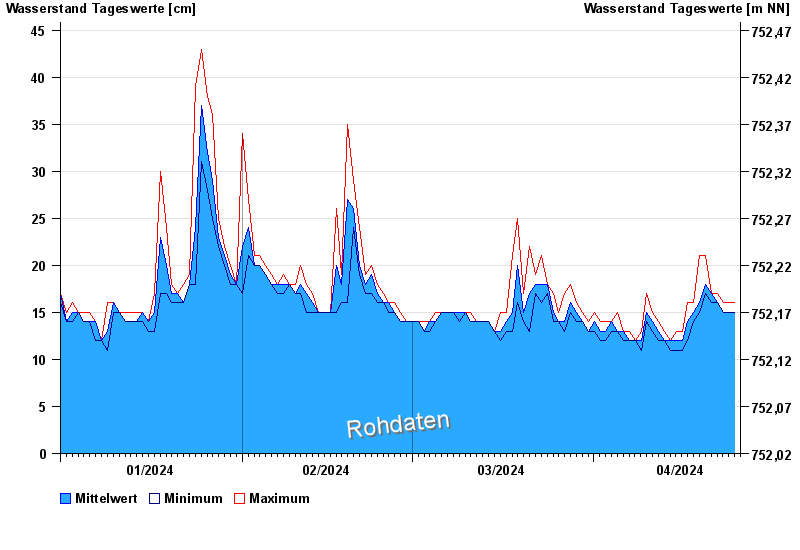
- Chart of year

Chart of year Bad Wiessee / Zeiselbach
Waterlevel from 01.01.2024 to 25.04.2024
- 10.06.1993 Wasserstand: 130 cm
- 30.06.1990 Wasserstand: 97 cm
- 13.06.2014 Wasserstand: 94 cm
- 21.05.1999 Wasserstand: 91 cm
- 02.06.2013 Wasserstand: 90 cm
| Date | Mean value [cm] | Maximum [cm] | Minimum [cm] |
|---|---|---|---|
| 25.04.2024 | 15 | 16 | 15 |
| 24.04.2024 | 15 | 16 | 15 |
| 23.04.2024 | 15 | 16 | 15 |
| 22.04.2024 | 16 | 17 | 16 |
| 21.04.2024 | 17 | 17 | 16 |
| 20.04.2024 | 18 | 21 | 17 |
| 19.04.2024 | 16 | 21 | 15 |
© Bayerisches Landesamt für Umwelt 2024