
- Start >
- Rivers >
- Waterlevel >
- Bayern >
- Anger >
- Chart of total period

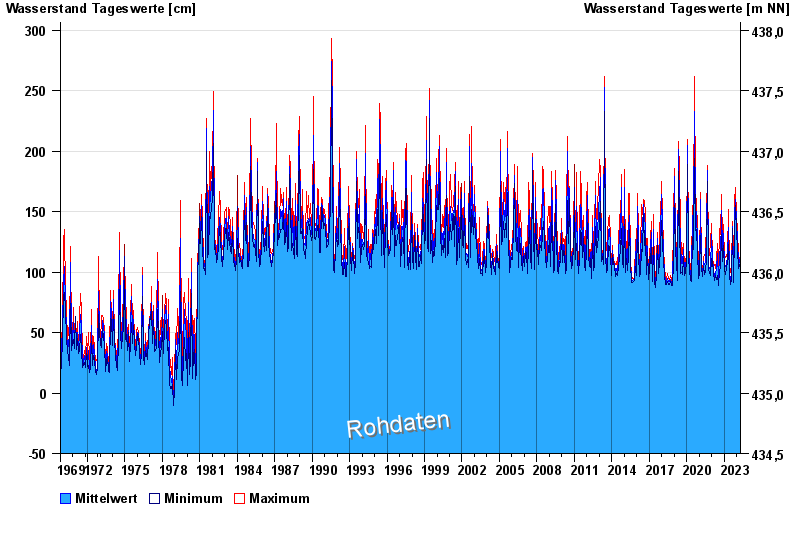
Chart of total period Anger / Attel
Waterlevel from 01.11.1969 to 24.04.2024
| Date | Mean value [cm] | Maximum [cm] | Minimum [cm] |
|---|---|---|---|
| 24.04.2024 | 101 | 103 | 97 |
| 23.04.2024 | 100 | 102 | 98 |
| 22.04.2024 | 103 | 106 | 100 |
| 21.04.2024 | 105 | 108 | 101 |
| 20.04.2024 | 100 | 102 | 98 |
| 19.04.2024 | 100 | 103 | 96 |
| 18.04.2024 | 101 | 108 | 98 |
© Bayerisches Landesamt für Umwelt 2024