
- Start >
- Rivers >
- Waterlevel >
- Bayern >
- Anger >
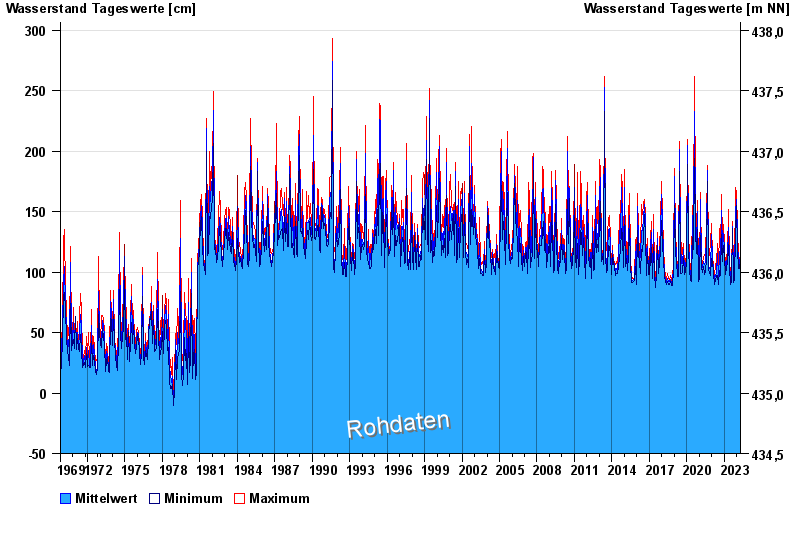
- Chart of total period

Chart of total period Anger / Attel
Waterlevel from 01.11.1969 to 19.04.2024
 Für diesen Pegel sind keine Hochwassermarken hinterlegt.
| Date | Mean value [cm] | Maximum [cm] | Minimum [cm] |
|---|---|---|---|
| 19.04.2024 | 101 | 103 | 99 |
| 18.04.2024 | 101 | 108 | 98 |
| 17.04.2024 | 95 | 99 | 90 |
| 16.04.2024 | 95 | 97 | 92 |
| 15.04.2024 | 93 | 97 | 90 |
| 14.04.2024 | 92 | 94 | 90 |
| 13.04.2024 | 92 | 95 | 90 |
© Bayerisches Landesamt für Umwelt 2024