
- Start >
- Rivers >
- Suspended sediment >
- Untere Donau >
- Passau Marienbrücke >
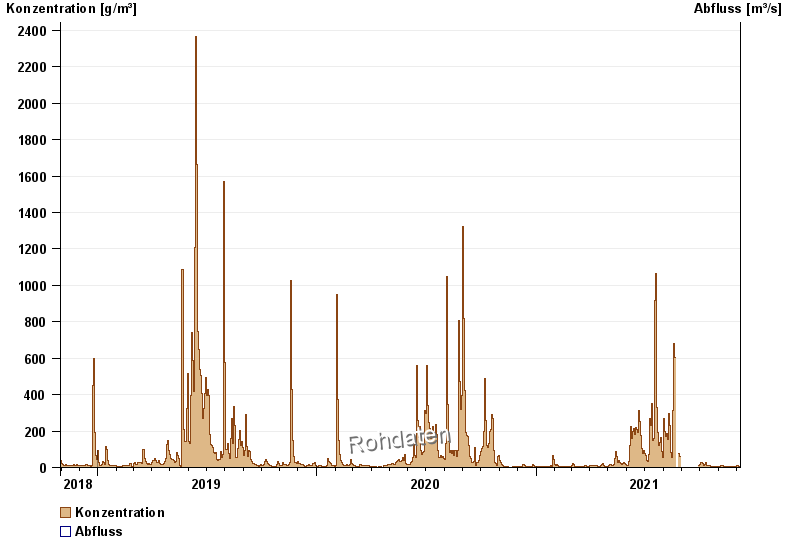
- Chart of total period

Chart of total period Passau Marienbrücke / Inn
Suspended sediment from 31.10.2018 to 07.12.2021
| Date | concentration [g/m³] | Runoff [m³/s] |
|---|---|---|
| 07.12.2021 | 7.4 | 0.0 |
| 06.12.2021 | 7.4 | 0.0 |
| 05.12.2021 | 7.3 | 0.0 |
| 04.12.2021 | 8.2 | 0.0 |
| 03.12.2021 | 8.3 | 0.0 |
| 02.12.2021 | 10.7 | 0.0 |
| 01.12.2021 | 6.1 | 0.0 |
© Bayerisches Landesamt für Umwelt 2024