
- Start >
- Rivers >
- Suspended sediment >
- Naab - Regen >
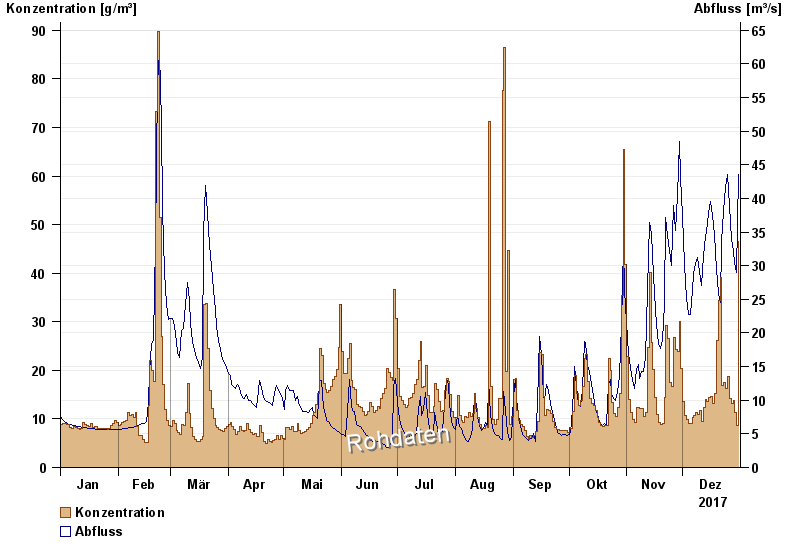
- Unterköblitz >
- Chart of year

Chart of year Unterköblitz / Naab
Suspended sediment from 01.01.2017 to 31.12.2017
| Date | concentration [g/m³] | Runoff [m³/s] |
|---|---|---|
| 31.12.2017 | 46.6 | 43.5 |
| 30.12.2017 | 8.7 | 29.0 |
| 29.12.2017 | 11.2 | 30.5 |
| 28.12.2017 | 13.9 | 32.1 |
| 27.12.2017 | 13.2 | 33.9 |
| 26.12.2017 | 14.2 | 38.9 |
| 25.12.2017 | 18.8 | 43.6 |
© Bayerisches Landesamt für Umwelt 2024