
- Start >
- Rivers >
- Suspended sediment >
- Naab - Regen >
- Hof >
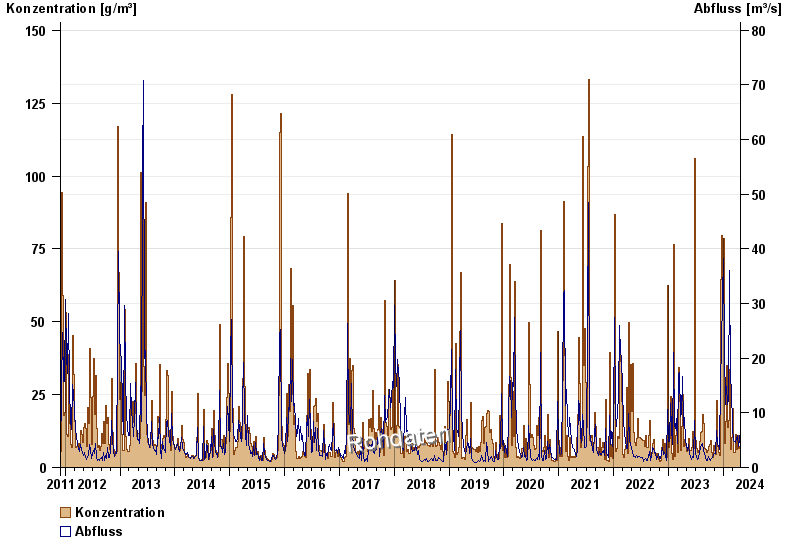
- Chart of total period

Chart of total period Hof / Sächsische Saale
Suspended sediment from 01.12.2011 to 23.04.2024
| Date | concentration [g/m³] | Runoff [m³/s] |
|---|---|---|
| 23.04.2024 | 10.8 | 5.0 |
| 22.04.2024 | 28.9 | 6.7 |
| 21.04.2024 | 12.9 | 6.3 |
| 20.04.2024 | 7.2 | 5.0 |
| 19.04.2024 | 5.8 | 3.1 |
| 18.04.2024 | 6.9 | 3.5 |
| 17.04.2024 | 7.2 | 3.7 |
© Bayerisches Landesamt für Umwelt 2024