
- Start >
- Rivers >
- Suspended sediment >
- Oberer Main - Elbe >
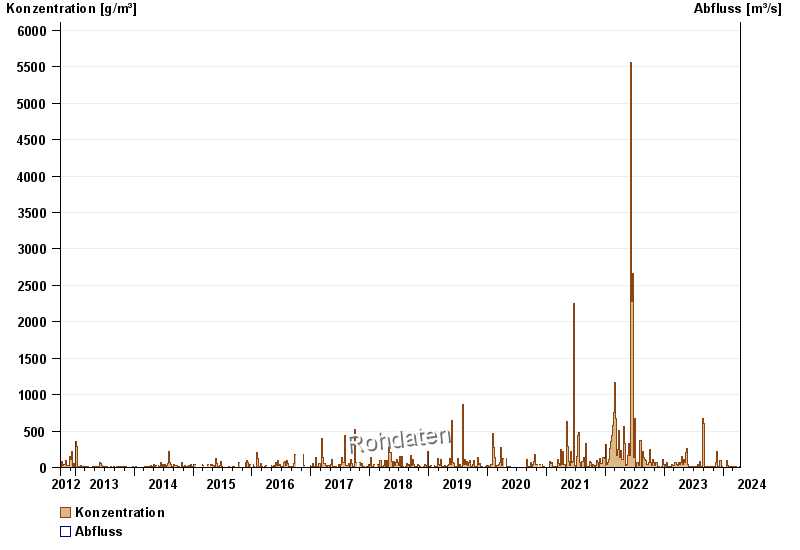
- Bad Tölz Brücke >
- Chart of total period

Chart of total period Bad Tölz Brücke / Isar
Suspended sediment from 01.10.2012 to 17.04.2024
| Date | concentration [g/m³] | Runoff [m³/s] |
|---|---|---|
| 17.04.2024 | 1.8 | 0.0 |
| 16.04.2024 | 3.7 | 0.0 |
| 15.04.2024 | 4.9 | 0.0 |
| 14.04.2024 | 3.1 | 0.0 |
| 13.04.2024 | 1.1 | 0.0 |
| 12.04.2024 | 15.5 | 0.0 |
| 11.04.2024 | 8.4 | 0.0 |
© Bayerisches Landesamt für Umwelt 2024