
- Start >
- Rivers >
- Discharge >
- Regnitz >
- Weinzierlein >
- Chart of year

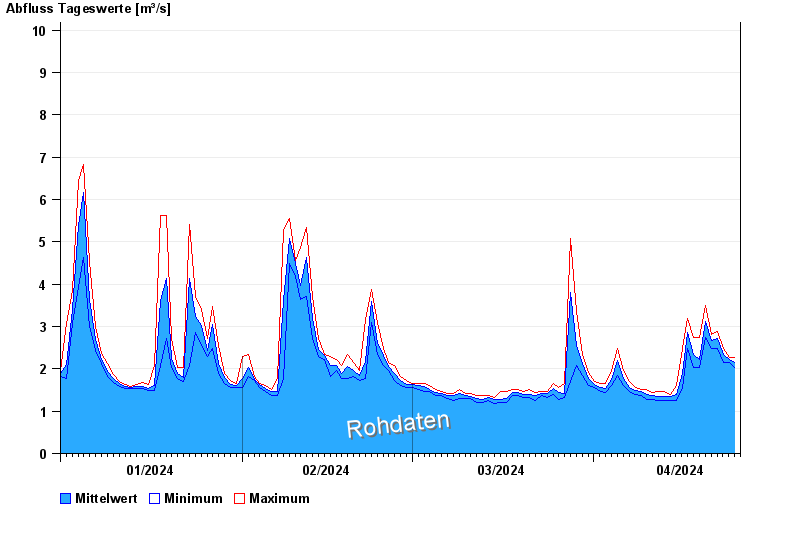
Chart of year Weinzierlein / Bibert
Discharge from 01.01.2024 to 25.04.2024
- 08.01.2011 Abfluss: 41,5 m³/s
- 14.01.2011 Abfluss: 24,7 m³/s
- 01.06.2013 Abfluss: 22,9 m³/s
- 09.12.2010 Abfluss: 20,9 m³/s
- 22.01.2012 Abfluss: 17,3 m³/s
| Date | Mean value [m³/s] | Maximum [m³/s] | Minimum [m³/s] |
|---|---|---|---|
| 25.04.2024 | 2.14 | 2.27 | 2.02 |
| 24.04.2024 | 2.23 | 2.27 | 2.14 |
| 23.04.2024 | 2.33 | 2.47 | 2.14 |
| 22.04.2024 | 2.72 | 2.89 | 2.47 |
| 21.04.2024 | 2.66 | 2.82 | 2.47 |
| 20.04.2024 | 3.12 | 3.5 | 2.75 |
| 19.04.2024 | 2.23 | 2.75 | 2.02 |
© Bayerisches Landesamt für Umwelt 2024