
- Start >
- Rivers >
- Discharge >
- Regnitz >
- Weinzierlein >
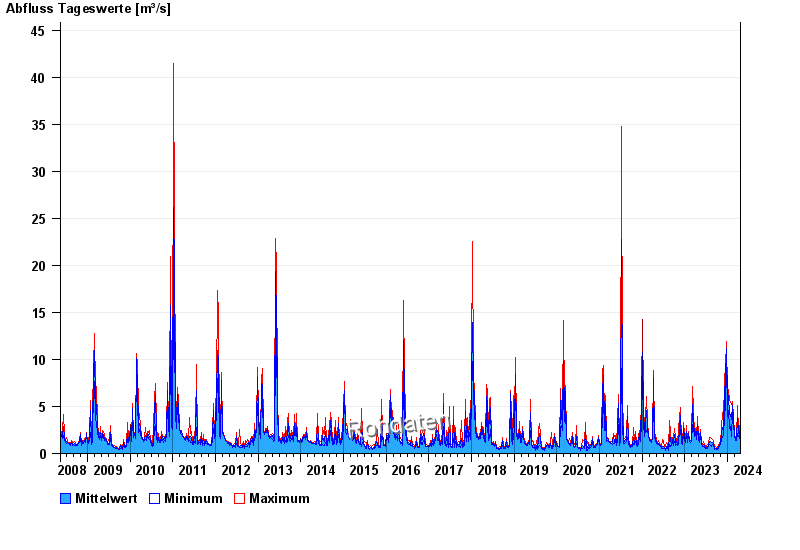
- Chart of total period

Chart of total period Weinzierlein / Bibert
Discharge from 14.05.2008 to 20.04.2024
| Date | Mean value [m³/s] | Maximum [m³/s] | Minimum [m³/s] |
|---|---|---|---|
| 20.04.2024 | 2.87 | 3.04 | 2.75 |
| 19.04.2024 | 2.23 | 2.75 | 2.02 |
| 18.04.2024 | 2.34 | 2.75 | 2.02 |
| 17.04.2024 | 2.85 | 3.2 | 2.47 |
| 16.04.2024 | 1.88 | 2.47 | 1.56 |
| 15.04.2024 | 1.39 | 1.6 | 1.25 |
| 14.04.2024 | 1.34 | 1.39 | 1.25 |
© Bayerisches Landesamt für Umwelt 2024