
- Start >
- Rivers >
- Discharge >
- Regnitz >
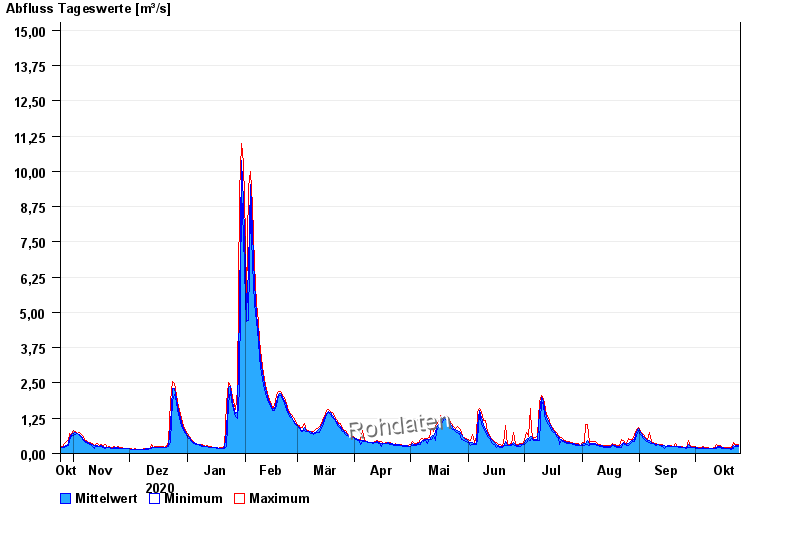
- Unterleinleiter >
- Chart of year

Chart of year Unterleinleiter / Leinleiterbach
Discharge from 25.10.2020 to 24.10.2021
- 23.02.1970 Abfluss: 31 m³/s
- 26.01.1995 Abfluss: 30,7 m³/s
- 06.01.1982 Abfluss: 23,5 m³/s
- 26.03.1988 Abfluss: 21 m³/s
- 14.01.2011 Abfluss: 19,1 m³/s
| Date | Mean value [m³/s] | Maximum [m³/s] | Minimum [m³/s] |
|---|---|---|---|
| 24.10.2021 | 0.284 | 0.303 | 0.252 |
| 23.10.2021 | 0.28 | 0.306 | 0.252 |
| 22.10.2021 | 0.264 | 0.309 | 0.233 |
| 21.10.2021 | 0.291 | 0.403 | 0.164 |
| 20.10.2021 | 0.174 | 0.217 | 0.15 |
| 19.10.2021 | 0.179 | 0.202 | 0.166 |
| 18.10.2021 | 0.186 | 0.204 | 0.168 |
© Bayerisches Landesamt für Umwelt 2024