
- Start >
- Rivers >
- Discharge >
- Regnitz >
- Unterleinleiter >
- Chart of total period

Chart of total period Unterleinleiter / Leinleiterbach
Discharge from 01.11.1958 to 19.04.2024
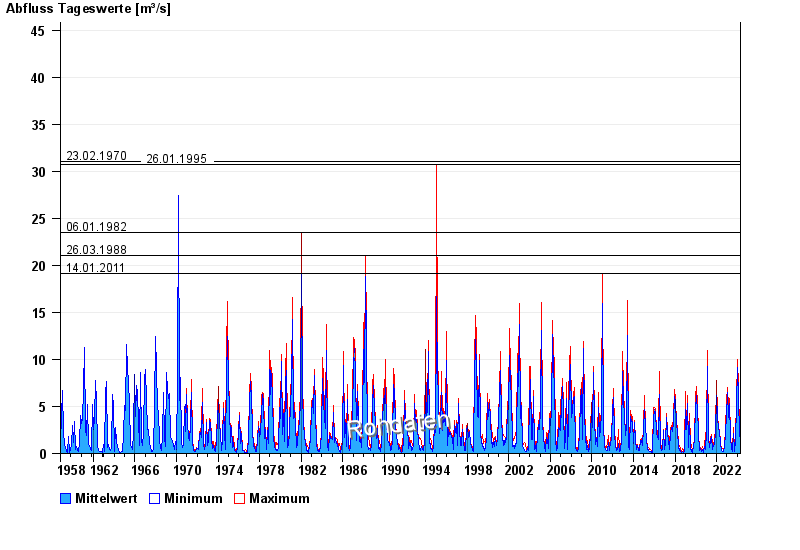
- 23.02.1970 Abfluss: 31 m³/s
- 26.01.1995 Abfluss: 30,7 m³/s
- 06.01.1982 Abfluss: 23,5 m³/s
- 26.03.1988 Abfluss: 21 m³/s
- 14.01.2011 Abfluss: 19,1 m³/s
| Date | Mean value [m³/s] | Maximum [m³/s] | Minimum [m³/s] |
|---|---|---|---|
| 19.04.2024 | 0.933 | 1.76 | 0.75 |
| 18.04.2024 | 0.8 | 0.844 | 0.75 |
| 17.04.2024 | 0.892 | 0.989 | 0.793 |
| 16.04.2024 | 0.932 | 1.15 | 0.844 |
| 15.04.2024 | 0.842 | 0.89 | 0.793 |
| 14.04.2024 | 0.882 | 0.942 | 0.844 |
| 13.04.2024 | 0.944 | 0.989 | 0.89 |
© Bayerisches Landesamt für Umwelt 2024