
- Start >
- Rivers >
- Discharge >
- Regnitz >
- Trunstadt Q >
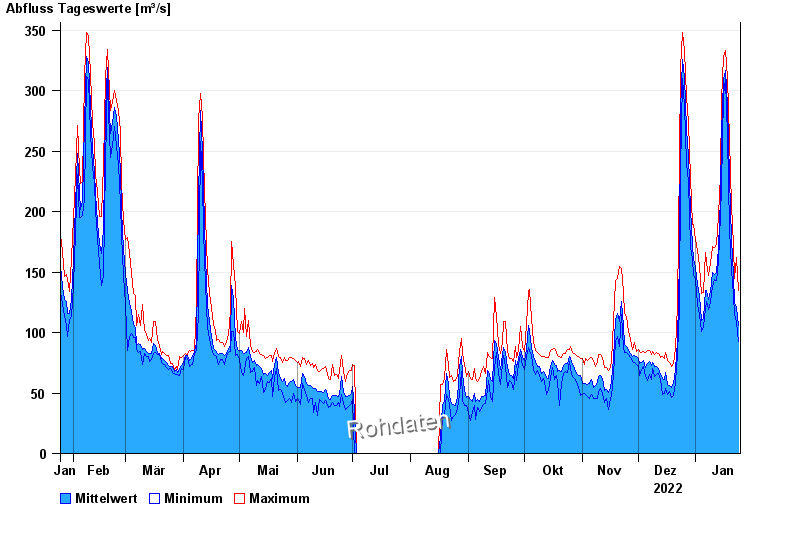
- Chart of year

Chart of year Trunstadt Q / Main
Discharge from 25.01.2022 to 24.01.2023
note
STÖRUNG BEHOBEN - Ultraschallanlage; kein Hochwasserpegel
| Date | Mean value [m³/s] | Maximum [m³/s] | Minimum [m³/s] |
|---|---|---|---|
| 24.01.2023 | 106 | 135 | 92.2 |
| 23.01.2023 | 121 | 162 | 108 |
| 22.01.2023 | 124 | 145 | 115 |
| 21.01.2023 | 148 | 172 | 131 |
| 20.01.2023 | 177 | 205 | 152 |
| 19.01.2023 | 228 | 260 | 186 |
| 18.01.2023 | 288 | 311 | 262 |
© Bayerisches Landesamt für Umwelt 2024