

Chart of year Thann / Altmühl
Discharge from 01.01.2024 to 16.04.2024
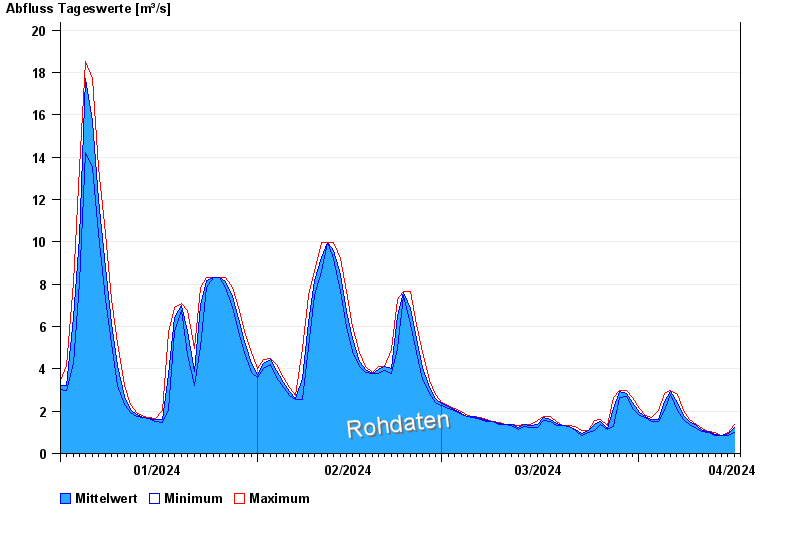
| Date | Mean value [m³/s] | Maximum [m³/s] | Minimum [m³/s] |
|---|---|---|---|
| 16.04.2024 | 1.15 | 1.34 | 1 |
| 15.04.2024 | 0.954 | 1 | 0.863 |
| 14.04.2024 | 0.863 | 0.863 | 0.863 |
| 13.04.2024 | 0.891 | 1 | 0.863 |
| 12.04.2024 | 1.03 | 1.05 | 1 |
| 11.04.2024 | 1.09 | 1.18 | 1.05 |
| 10.04.2024 | 1.31 | 1.39 | 1.18 |
© Bayerisches Landesamt für Umwelt 2024