

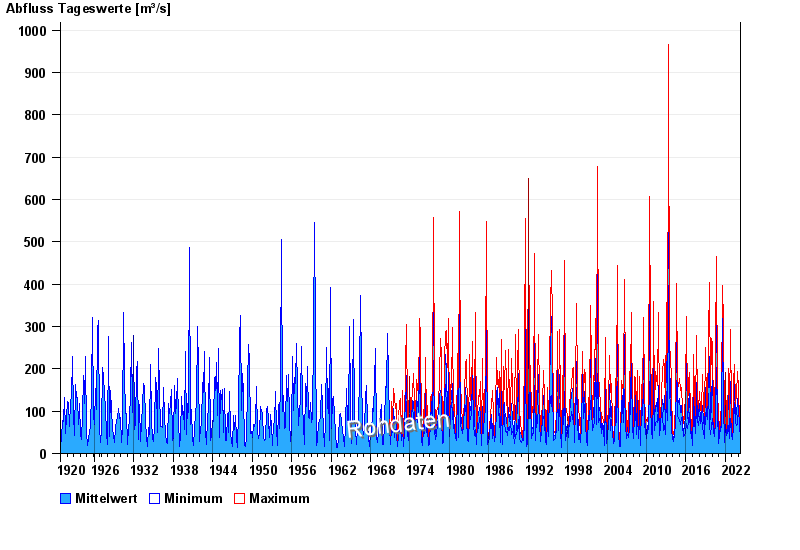
Chart of total period Staudach / Tiroler Achen
Discharge from 01.11.1920 to 19.04.2024
| Date | Mean value [m³/s] | Maximum [m³/s] | Minimum [m³/s] |
|---|---|---|---|
| 19.04.2024 | 35.1 | 36.6 | 33.6 |
| 18.04.2024 | 36.9 | 39.7 | 35.9 |
| 17.04.2024 | 39 | 42.1 | 38.1 |
| 16.04.2024 | 49.9 | 64.7 | 42.1 |
| 15.04.2024 | 37.2 | 42.1 | 35.1 |
| 14.04.2024 | 35.5 | 40.5 | 32.9 |
| 13.04.2024 | 33.9 | 38.9 | 31.4 |
© Bayerisches Landesamt für Umwelt 2024