
- Start >
- Rivers >
- Discharge >
- Regnitz >
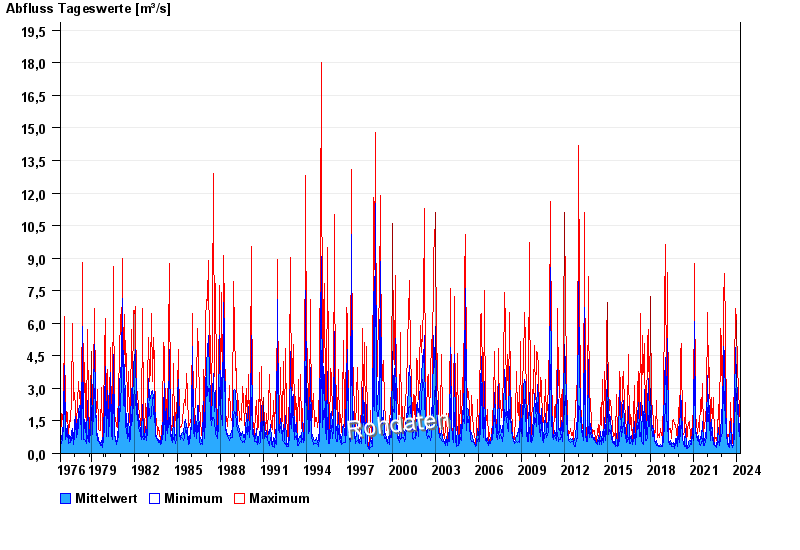
- Schnaittach Markt >
- Chart of total period

Chart of total period Schnaittach Markt / Schnaittach
Discharge from 01.11.1976 to 19.04.2024
| Date | Mean value [m³/s] | Maximum [m³/s] | Minimum [m³/s] |
|---|---|---|---|
| 19.04.2024 | 0.619 | 0.619 | 0.619 |
| 18.04.2024 | 0.619 | 0.619 | 0.619 |
| 17.04.2024 | 0.629 | 0.671 | 0.619 |
| 16.04.2024 | 0.633 | 0.729 | 0.619 |
| 15.04.2024 | 0.621 | 0.671 | 0.619 |
| 14.04.2024 | 0.621 | 0.671 | 0.619 |
| 13.04.2024 | 0.62 | 0.671 | 0.619 |
© Bayerisches Landesamt für Umwelt 2024