
- Start >
- Rivers >
- Discharge >
- Regnitz >
- Schnaittach Markt >
- Chart of total period

Chart of total period Schnaittach Markt / Schnaittach
Discharge from 01.11.1976 to 24.04.2024
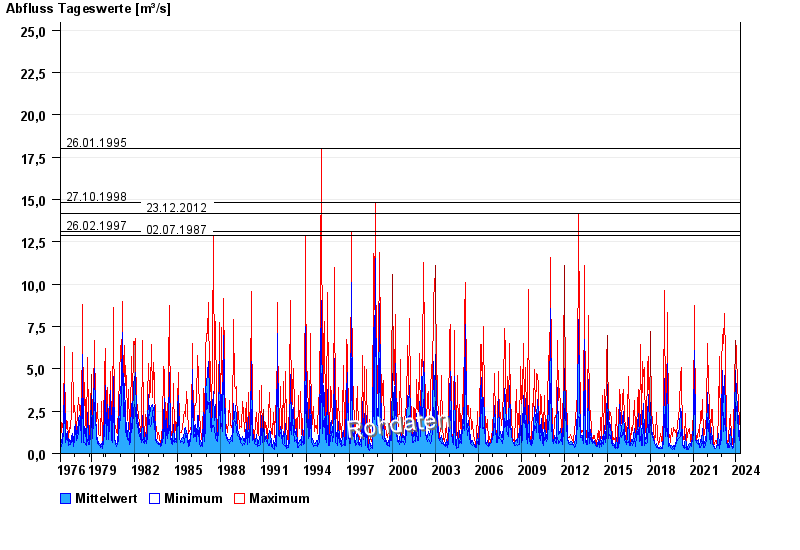
- 26.01.1995 Abfluss: 18 m³/s
- 27.10.1998 Abfluss: 14,8 m³/s
- 23.12.2012 Abfluss: 14,2 m³/s
- 26.02.1997 Abfluss: 13,1 m³/s
- 02.07.1987 Abfluss: 12,9 m³/s
| Date | Mean value [m³/s] | Maximum [m³/s] | Minimum [m³/s] |
|---|---|---|---|
| 24.04.2024 | 0.809 | 0.838 | 0.783 |
| 23.04.2024 | 0.856 | 1.14 | 0.671 |
| 22.04.2024 | 1.02 | 1.34 | 0.783 |
| 21.04.2024 | 1.33 | 2.06 | 0.671 |
| 20.04.2024 | 1.08 | 1.76 | 0.671 |
| 19.04.2024 | 0.99 | 2.06 | 0.619 |
| 18.04.2024 | 0.619 | 0.619 | 0.619 |
© Bayerisches Landesamt für Umwelt 2024