
- Start >
- Rivers >
- Discharge >
- Regnitz >
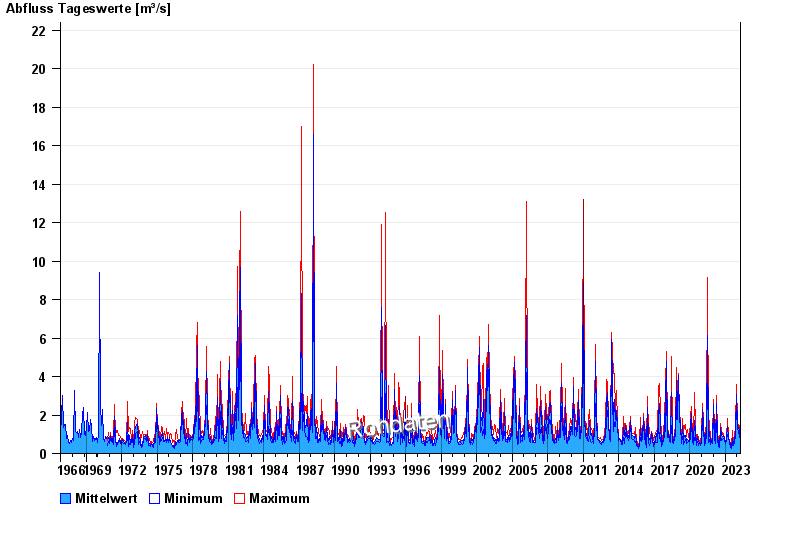
- Rothaurach >
- Chart of total period

Chart of total period Rothaurach / Aurach
Discharge from 01.11.1966 to 19.04.2024
| Date | Mean value [m³/s] | Maximum [m³/s] | Minimum [m³/s] |
|---|---|---|---|
| 19.04.2024 | 0.475 | 0.475 | 0.475 |
| 18.04.2024 | 0.531 | 0.56 | 0.475 |
| 17.04.2024 | 0.587 | 0.619 | 0.53 |
| 16.04.2024 | 0.529 | 0.56 | 0.503 |
| 15.04.2024 | 0.526 | 0.56 | 0.475 |
| 14.04.2024 | 0.511 | 0.53 | 0.503 |
| 13.04.2024 | 0.526 | 0.53 | 0.503 |
© Bayerisches Landesamt für Umwelt 2024