
- Start >
- Rivers >
- Discharge >
- Regnitz >
- Rothaurach >
- Chart of total period

Chart of total period Rothaurach / Aurach
Discharge from 01.11.1966 to 25.04.2024
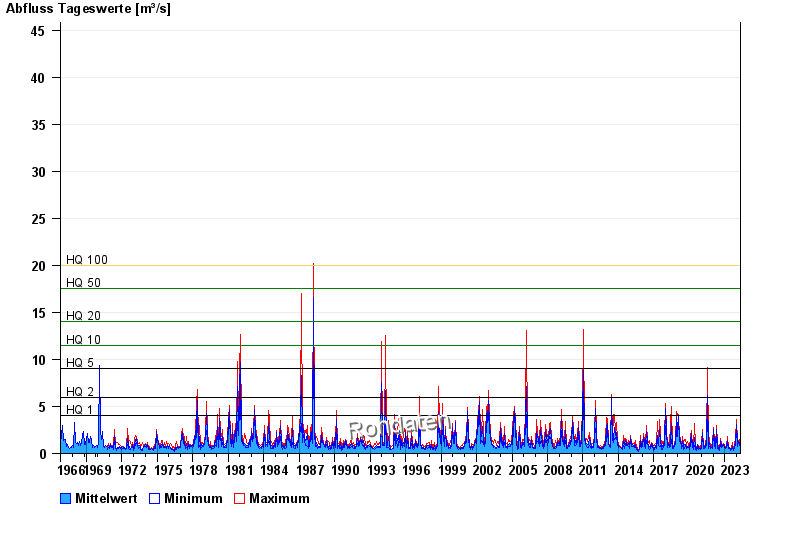
- HQ1 4 m³/s
- HQ2 6 m³/s
- HQ5 9 m³/s
- HQ10 11,5 m³/s
- HQ20 14 m³/s
- HQ50 17,5 m³/s
- HQ100 20 m³/s
| Date | Mean value [m³/s] | Maximum [m³/s] | Minimum [m³/s] |
|---|---|---|---|
| 25.04.2024 | 0.475 | 0.475 | 0.475 |
| 24.04.2024 | 0.486 | 0.53 | 0.475 |
| 23.04.2024 | 0.544 | 0.589 | 0.53 |
| 22.04.2024 | 0.637 | 0.65 | 0.589 |
| 21.04.2024 | 0.58 | 0.589 | 0.56 |
| 20.04.2024 | 0.639 | 0.682 | 0.589 |
| 19.04.2024 | 0.497 | 0.589 | 0.475 |
© Bayerisches Landesamt für Umwelt 2024