
- Start >
- Rivers >
- Discharge >
- Regnitz >
- Reichenbach >
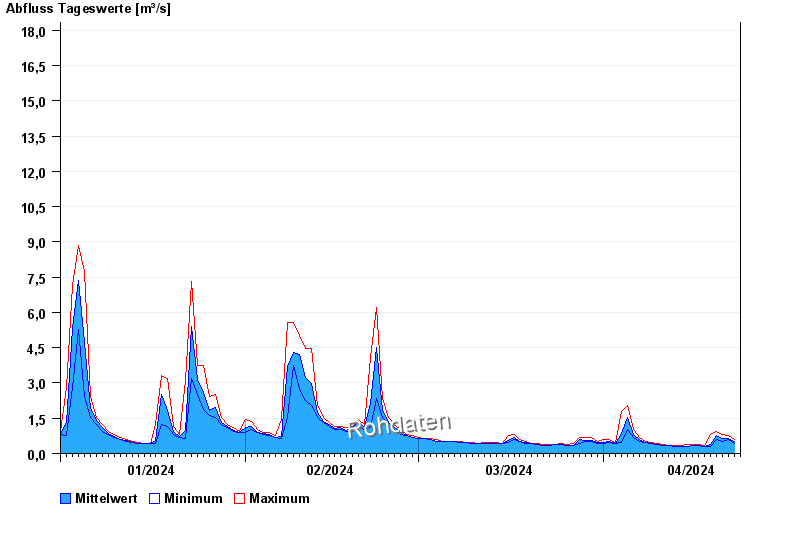
- Chart of year

Chart of year Reichenbach / Wörnitz
Discharge from 01.01.2024 to 23.04.2024
- HQ1 19 m³/s
- HQ2 26 m³/s
- HQ5 36 m³/s
- HQ10 43 m³/s
- HQ20 50 m³/s
- HQ50 60 m³/s
- HQ100 68 m³/s
| Date | Mean value [m³/s] | Maximum [m³/s] | Minimum [m³/s] |
|---|---|---|---|
| 23.04.2024 | 0.526 | 0.576 | 0.522 |
| 22.04.2024 | 0.649 | 0.752 | 0.576 |
| 21.04.2024 | 0.656 | 0.813 | 0.522 |
| 20.04.2024 | 0.765 | 0.945 | 0.576 |
| 19.04.2024 | 0.402 | 0.813 | 0.288 |
| 18.04.2024 | 0.297 | 0.331 | 0.288 |
| 17.04.2024 | 0.346 | 0.375 | 0.331 |
© Bayerisches Landesamt für Umwelt 2024