
- Start >
- Rivers >
- Discharge >
- Regnitz >
- Reichenbach >
- Chart of total period

Chart of total period Reichenbach / Wörnitz
Discharge from 01.11.1969 to 25.04.2024
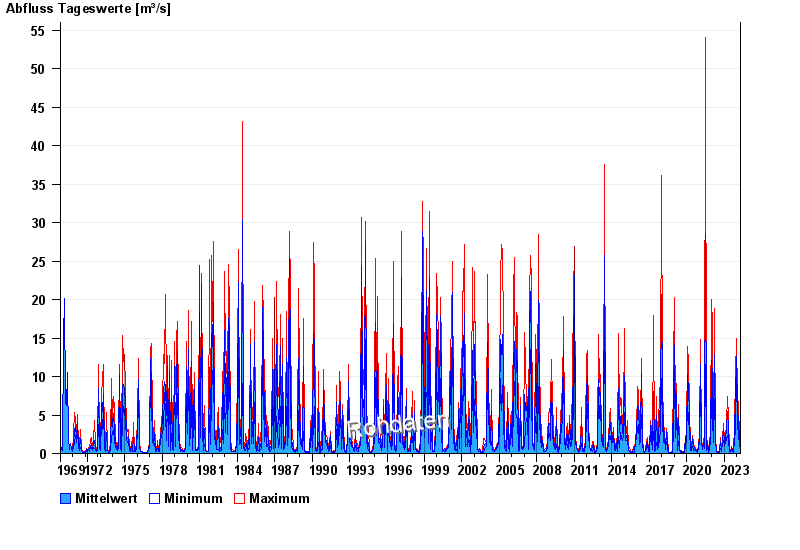
| Date | Mean value [m³/s] | Maximum [m³/s] | Minimum [m³/s] |
|---|---|---|---|
| 25.04.2024 | 0.394 | 0.471 | 0.375 |
| 24.04.2024 | 0.421 | 0.421 | 0.421 |
| 23.04.2024 | 0.491 | 0.576 | 0.421 |
| 22.04.2024 | 0.649 | 0.752 | 0.576 |
| 21.04.2024 | 0.656 | 0.813 | 0.522 |
| 20.04.2024 | 0.765 | 0.945 | 0.576 |
| 19.04.2024 | 0.402 | 0.813 | 0.288 |
© Bayerisches Landesamt für Umwelt 2024