
- Start >
- Rivers >
- Discharge >
- Regnitz >
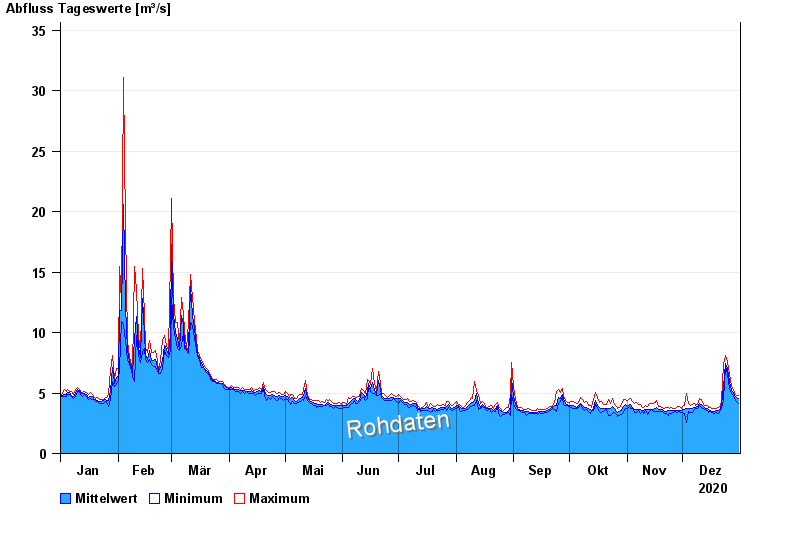
- Muggendorf >
- Chart of year

Chart of year Muggendorf / Wiesent
Discharge from 01.01.2020 to 31.12.2020
| Date | Mean value [m³/s] | Maximum [m³/s] | Minimum [m³/s] |
|---|---|---|---|
| 31.12.2020 | 4.53 | 4.82 | 4.12 |
| 30.12.2020 | 4.61 | 4.76 | 4.33 |
| 29.12.2020 | 4.77 | 4.99 | 4.56 |
| 28.12.2020 | 5.06 | 5.28 | 4.83 |
| 27.12.2020 | 5.22 | 5.56 | 4.95 |
| 26.12.2020 | 5.95 | 6.52 | 5.39 |
| 25.12.2020 | 7.02 | 7.57 | 6.5 |
© Bayerisches Landesamt für Umwelt 2024