
- Start >
- Rivers >
- Discharge >
- Regnitz >
- Muggendorf >
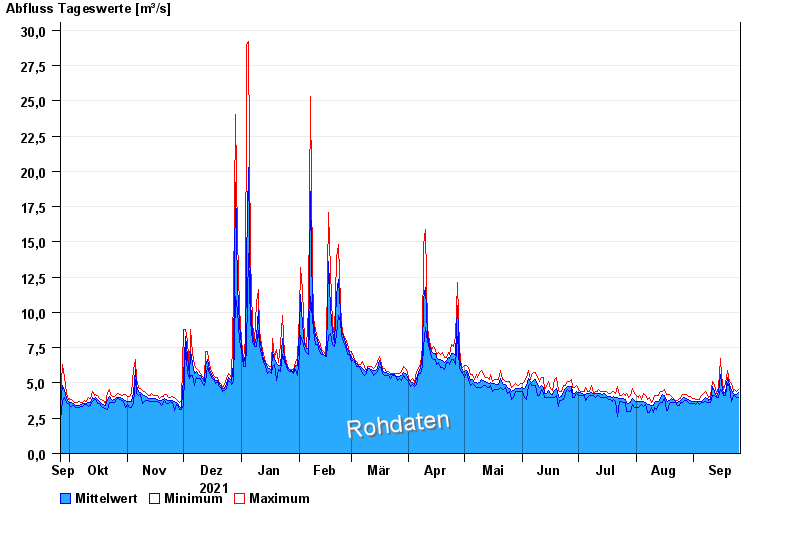
- Chart of year

Chart of year Muggendorf / Wiesent
Discharge from 26.09.2021 to 25.09.2022
| Date | Mean value [m³/s] | Maximum [m³/s] | Minimum [m³/s] |
|---|---|---|---|
| 25.09.2022 | 4.29 | 4.52 | 3.98 |
| 24.09.2022 | 4.15 | 4.38 | 3.98 |
| 23.09.2022 | 4.15 | 4.52 | 4.1 |
| 22.09.2022 | 4.25 | 4.38 | 4.1 |
| 21.09.2022 | 4.49 | 4.95 | 3.72 |
| 20.09.2022 | 4.86 | 5.1 | 4.66 |
| 19.09.2022 | 5.4 | 5.87 | 4.95 |
© Bayerisches Landesamt für Umwelt 2024