
- Start >
- Rivers >
- Discharge >
- Regnitz >
- Muggendorf >
- Chart of year

Chart of year Muggendorf / Wiesent
Discharge from 01.01.2022 to 31.12.2022
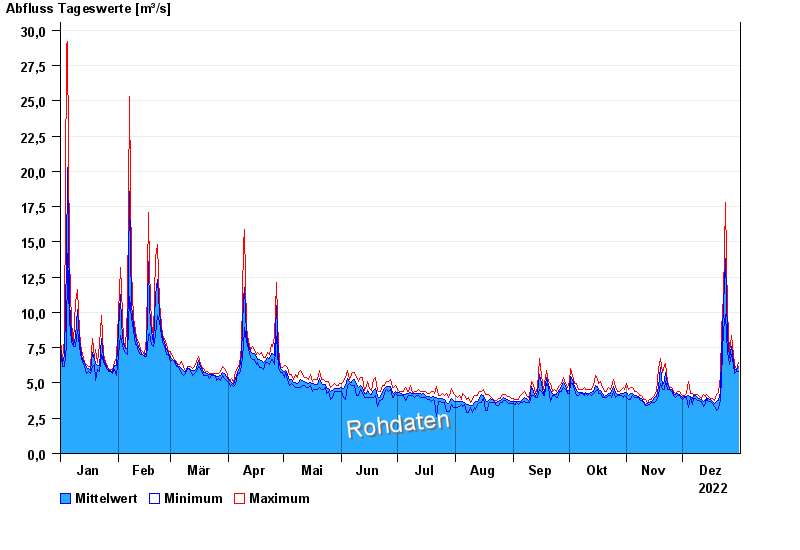
| Date | Mean value [m³/s] | Maximum [m³/s] | Minimum [m³/s] |
|---|---|---|---|
| 31.12.2022 | 6.14 | 6.46 | 5.8 |
| 30.12.2022 | 5.88 | 5.96 | 5.8 |
| 29.12.2022 | 6 | 6.29 | 5.64 |
| 28.12.2022 | 6.51 | 7 | 6.29 |
| 27.12.2022 | 7.56 | 8.33 | 7 |
| 26.12.2022 | 6.78 | 7.18 | 6.29 |
| 25.12.2022 | 8.29 | 10 | 7.18 |
© Bayerisches Landesamt für Umwelt 2024