
- Start >
- Rivers >
- Discharge >
- Regnitz >
- Muggendorf >
- Chart of year

Chart of year Muggendorf / Wiesent
Discharge from 01.01.2018 to 31.12.2018
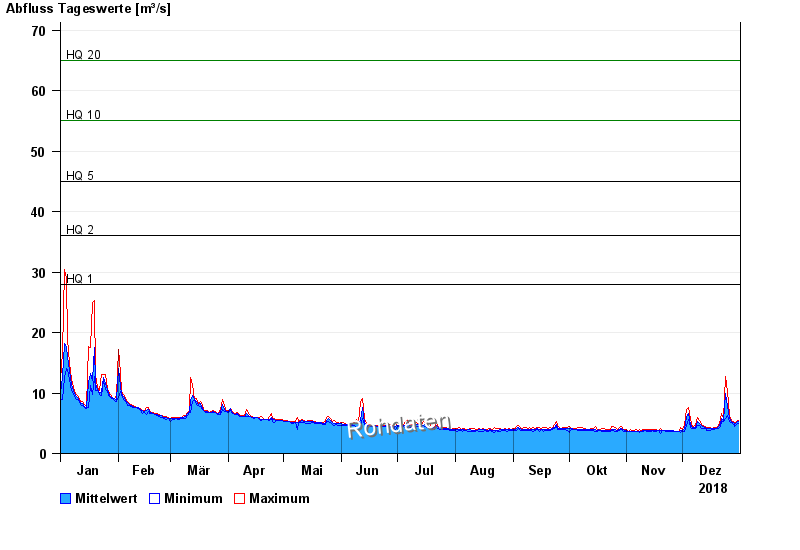
- HQ1 28 m³/s
- HQ2 36 m³/s
- HQ5 45 m³/s
- HQ10 55 m³/s
- HQ20 65 m³/s
- HQ50 80 m³/s
- HQ100 90 m³/s
| Date | Mean value [m³/s] | Maximum [m³/s] | Minimum [m³/s] |
|---|---|---|---|
| 31.12.2018 | 5.29 | 5.45 | 5.01 |
| 30.12.2018 | 5.1 | 5.29 | 4.82 |
| 29.12.2018 | 4.81 | 4.96 | 4.52 |
| 28.12.2018 | 5.06 | 5.24 | 4.8 |
| 27.12.2018 | 5.28 | 5.51 | 5.08 |
| 26.12.2018 | 5.82 | 6.31 | 5.35 |
| 25.12.2018 | 7.79 | 10.3 | 6.3 |
© Bayerisches Landesamt für Umwelt 2024