
- Start >
- Rivers >
- Discharge >
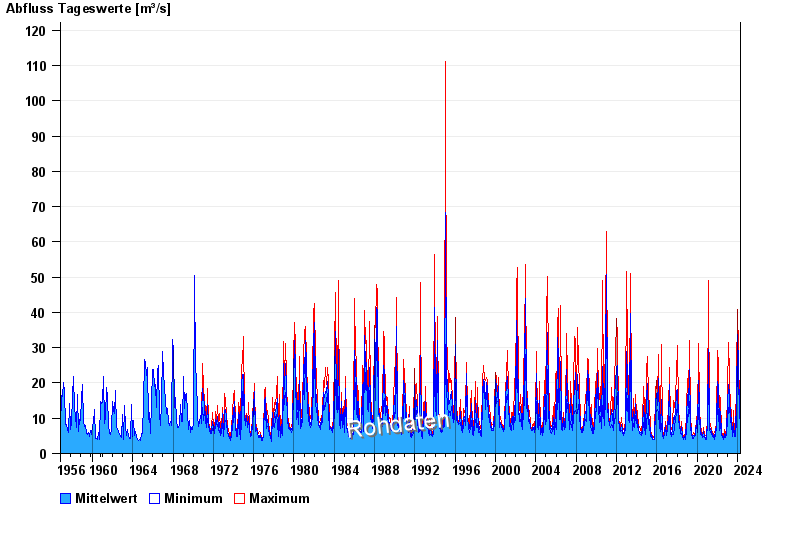
- Regnitz >
- Muggendorf >
- Chart of total period

Chart of total period Muggendorf / Wiesent
Discharge from 01.11.1956 to 19.04.2024
| Date | Mean value [m³/s] | Maximum [m³/s] | Minimum [m³/s] |
|---|---|---|---|
| 19.04.2024 | 7.63 | 7.72 | 7.54 |
| 18.04.2024 | 7.67 | 8.69 | 7.54 |
| 17.04.2024 | 7.98 | 8.49 | 7.54 |
| 16.04.2024 | 7.48 | 8.1 | 6.99 |
| 15.04.2024 | 7.23 | 7.36 | 6.99 |
| 14.04.2024 | 7.23 | 7.36 | 6.99 |
| 13.04.2024 | 7.27 | 7.36 | 6.99 |
© Bayerisches Landesamt für Umwelt 2024