

Chart of year Lauf / Pegnitz
Discharge from 01.11.2020 to 31.10.2021
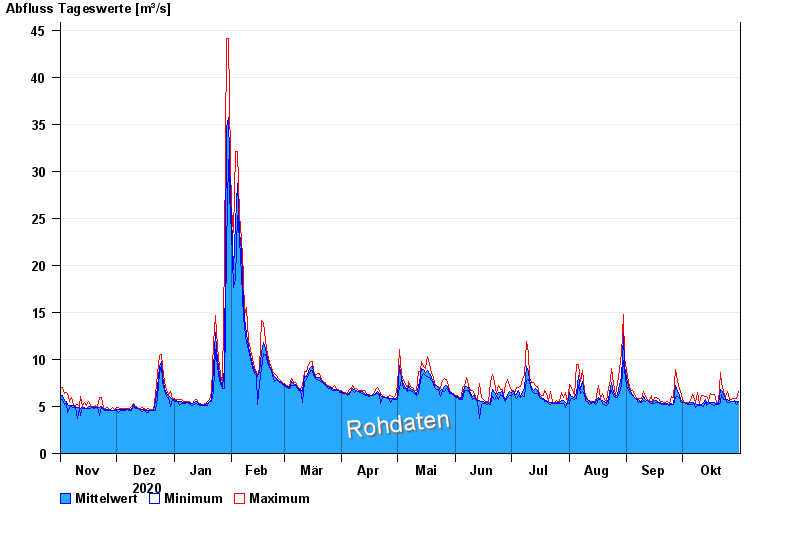
| Date | Mean value [m³/s] | Maximum [m³/s] | Minimum [m³/s] |
|---|---|---|---|
| 31.10.2021 | 5.56 | 6.62 | 5.52 |
| 30.10.2021 | 5.56 | 5.81 | 5.25 |
| 29.10.2021 | 5.63 | 5.88 | 5.52 |
| 28.10.2021 | 5.57 | 5.88 | 5.52 |
| 27.10.2021 | 5.58 | 5.74 | 5.52 |
| 26.10.2021 | 5.61 | 5.74 | 5.45 |
| 25.10.2021 | 5.71 | 6.54 | 5.39 |
© Bayerisches Landesamt für Umwelt 2024