
- Start >
- Rivers >
- Discharge >
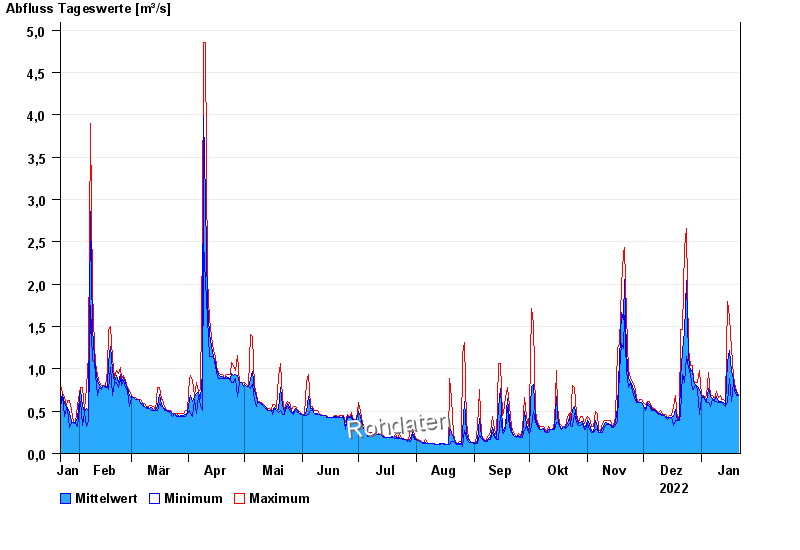
- Regnitz >
- Laubendorf >
- Chart of year

Chart of year Laubendorf / Zenn
Discharge from 22.01.2022 to 21.01.2023
| Date | Mean value [m³/s] | Maximum [m³/s] | Minimum [m³/s] |
|---|---|---|---|
| 21.01.2023 | 0.688 | 0.688 | 0.688 |
| 20.01.2023 | 0.725 | 0.737 | 0.688 |
| 19.01.2023 | 0.763 | 0.833 | 0.737 |
| 18.01.2023 | 0.871 | 0.907 | 0.833 |
| 17.01.2023 | 0.971 | 1.24 | 0.62 |
| 16.01.2023 | 1.22 | 1.61 | 0.882 |
| 15.01.2023 | 1.09 | 1.8 | 0.597 |
© Bayerisches Landesamt für Umwelt 2024