
- Start >
- Rivers >
- Discharge >
- Regnitz >
- Laubendorf >
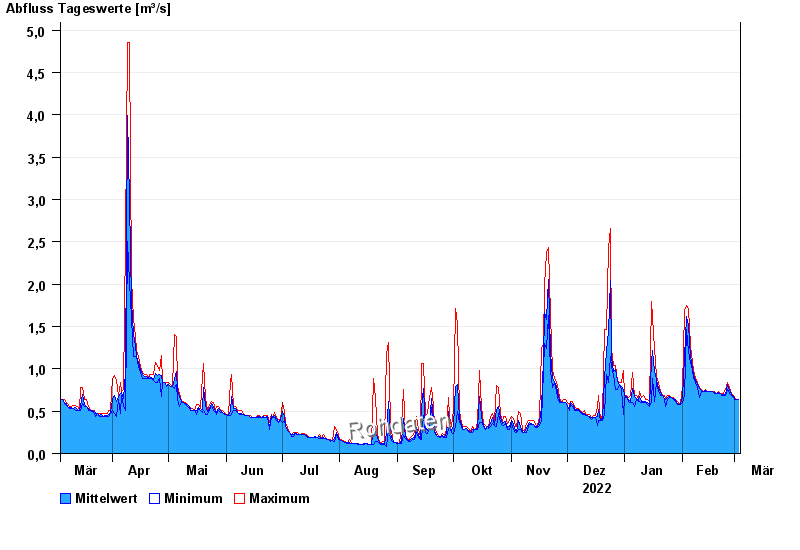
- Chart of year

Chart of year Laubendorf / Zenn
Discharge from 04.03.2022 to 03.03.2023
| Date | Mean value [m³/s] | Maximum [m³/s] | Minimum [m³/s] |
|---|---|---|---|
| 03.03.2023 | 0.643 | 0.643 | 0.643 |
| 02.03.2023 | 0.643 | 0.643 | 0.643 |
| 01.03.2023 | 0.645 | 0.666 | 0.643 |
| 28.02.2023 | 0.671 | 0.69 | 0.666 |
| 27.02.2023 | 0.691 | 0.714 | 0.69 |
| 26.02.2023 | 0.739 | 0.782 | 0.714 |
| 25.02.2023 | 0.813 | 0.834 | 0.761 |
© Bayerisches Landesamt für Umwelt 2024