
- Start >
- Rivers >
- Discharge >
- Regnitz >
- Laubendorf >
- Chart of year

Chart of year Laubendorf / Zenn
Discharge from 01.01.2020 to 31.12.2020
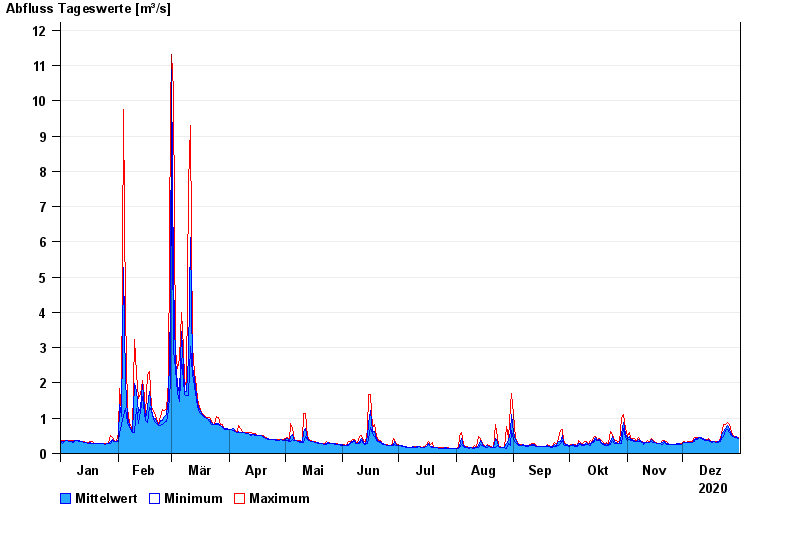
| Date | Mean value [m³/s] | Maximum [m³/s] | Minimum [m³/s] |
|---|---|---|---|
| 31.12.2020 | 0.436 | 0.465 | 0.429 |
| 30.12.2020 | 0.481 | 0.484 | 0.465 |
| 29.12.2020 | 0.465 | 0.483 | 0.444 |
| 28.12.2020 | 0.494 | 0.52 | 0.481 |
| 27.12.2020 | 0.54 | 0.602 | 0.5 |
| 26.12.2020 | 0.688 | 0.813 | 0.602 |
| 25.12.2020 | 0.801 | 0.891 | 0.667 |
© Bayerisches Landesamt für Umwelt 2024