
- Start >
- Rivers >
- Discharge >
- Regnitz >
- Laubendorf >
- Chart of total period

Chart of total period Laubendorf / Zenn
Discharge from 01.11.1954 to 20.04.2024
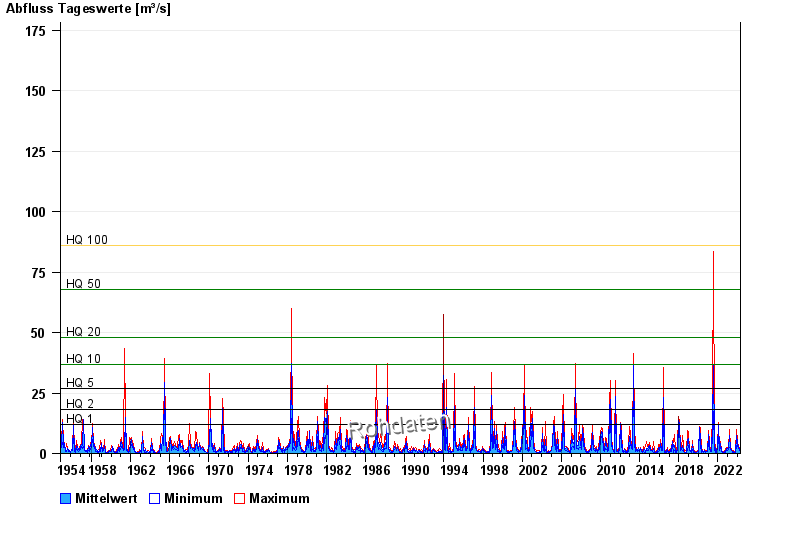
- HQ1 12 m³/s
- HQ2 18 m³/s
- HQ5 27 m³/s
- HQ10 37 m³/s
- HQ20 48 m³/s
- HQ50 68 m³/s
- HQ100 86 m³/s
| Date | Mean value [m³/s] | Maximum [m³/s] | Minimum [m³/s] |
|---|---|---|---|
| 20.04.2024 | 1.12 | 1.14 | 1.09 |
| 19.04.2024 | 0.914 | 1.14 | 0.792 |
| 18.04.2024 | 0.811 | 0.893 | 0.792 |
| 17.04.2024 | 0.97 | 1.12 | 0.792 |
| 16.04.2024 | 0.816 | 1.12 | 0.722 |
| 15.04.2024 | 0.696 | 0.722 | 0.652 |
| 14.04.2024 | 0.699 | 0.699 | 0.699 |
© Bayerisches Landesamt für Umwelt 2024