
- Start >
- Rivers >
- Discharge >
- Regnitz >
- Kreppendorf >
- Chart of year

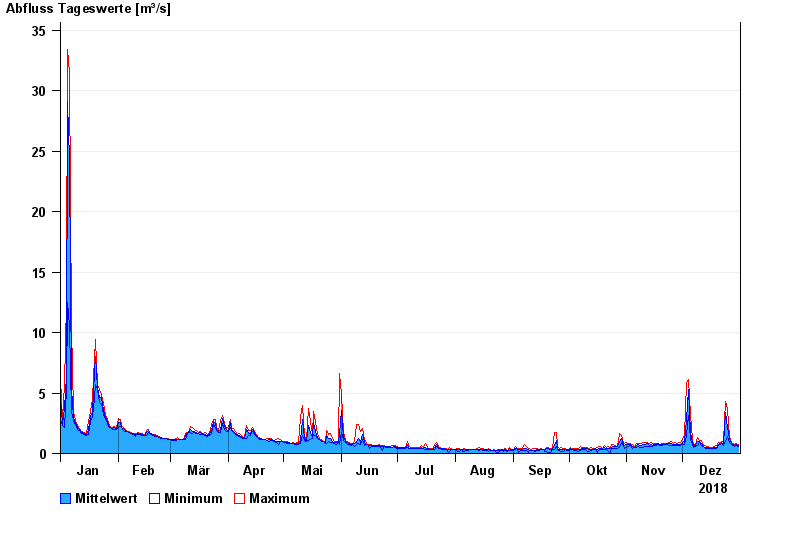
Chart of year Kreppendorf / Zenn
Discharge from 01.01.2018 to 31.12.2018
| Date | Mean value [m³/s] | Maximum [m³/s] | Minimum [m³/s] |
|---|---|---|---|
| 31.12.2018 | 0.671 | 0.784 | 0.603 |
| 30.12.2018 | 0.777 | 0.816 | 0.661 |
| 29.12.2018 | 0.659 | 0.721 | 0.574 |
| 28.12.2018 | 0.736 | 0.815 | 0.661 |
| 27.12.2018 | 0.852 | 0.947 | 0.752 |
| 26.12.2018 | 1.14 | 1.42 | 0.947 |
| 25.12.2018 | 2.14 | 3.67 | 1.42 |
© Bayerisches Landesamt für Umwelt 2024