
- Start >
- Rivers >
- Discharge >
- Regnitz >
- Kreppendorf >
- Chart of year

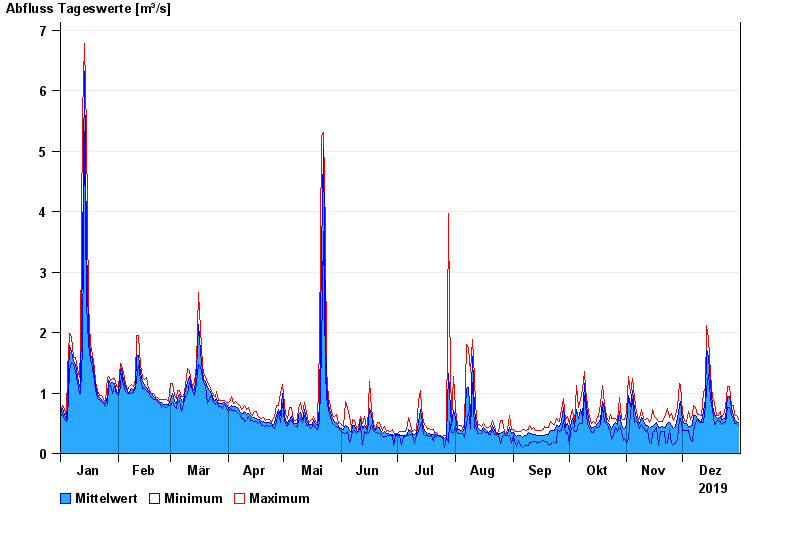
Chart of year Kreppendorf / Zenn
Discharge from 01.01.2019 to 31.12.2019
| Date | Mean value [m³/s] | Maximum [m³/s] | Minimum [m³/s] |
|---|---|---|---|
| 31.12.2019 | 0.511 | 0.568 | 0.466 |
| 30.12.2019 | 0.527 | 0.622 | 0.489 |
| 29.12.2019 | 0.567 | 0.649 | 0.488 |
| 28.12.2019 | 0.63 | 0.8 | 0.564 |
| 27.12.2019 | 0.737 | 0.8 | 0.646 |
| 26.12.2019 | 0.935 | 1.1 | 0.767 |
| 25.12.2019 | 0.949 | 1.1 | 0.763 |
© Bayerisches Landesamt für Umwelt 2024