
- Start >
- Rivers >
- Discharge >
- Regnitz >
- Kreppendorf >
- Chart of year

Chart of year Kreppendorf / Zenn
Discharge from 14.07.2020 to 13.07.2021
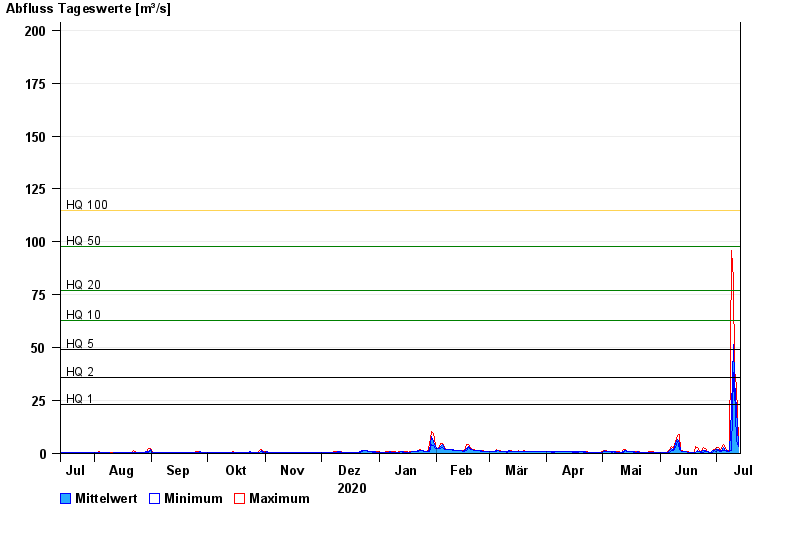
- HQ1 23 m³/s
- HQ2 36 m³/s
- HQ5 49 m³/s
- HQ10 63 m³/s
- HQ20 77 m³/s
- HQ50 98 m³/s
- HQ100 115 m³/s
| Date | Mean value [m³/s] | Maximum [m³/s] | Minimum [m³/s] |
|---|---|---|---|
| 13.07.2021 | 3.78 | 5.98 | 3.09 |
| 12.07.2021 | 20.8 | 31.7 | 5.98 |
| 11.07.2021 | 34.7 | 39.5 | 30.8 |
| 10.07.2021 | 51.4 | 82 | 38.5 |
| 09.07.2021 | 21 | 95.9 | 1.21 |
| 08.07.2021 | 1.16 | 1.28 | 1.06 |
| 07.07.2021 | 1.19 | 1.25 | 1.1 |
© Bayerisches Landesamt für Umwelt 2024