
- Start >
- Rivers >
- Discharge >
- Regnitz >
- Kreppendorf >
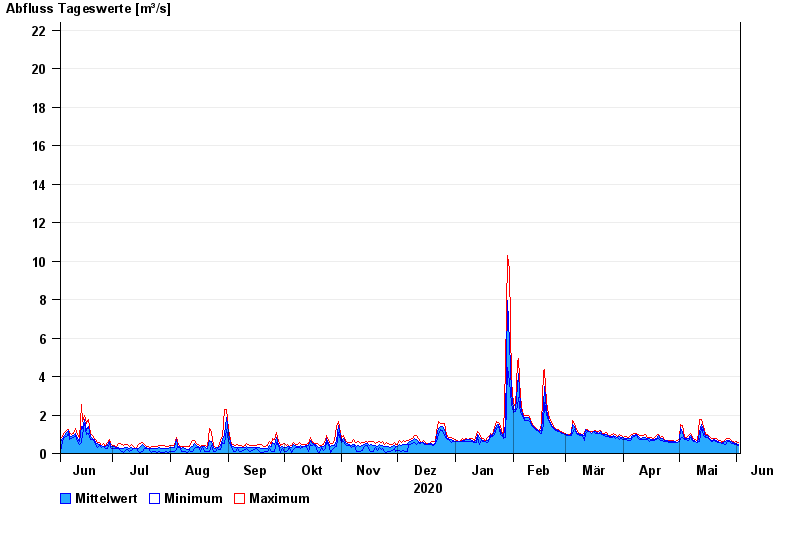
- Chart of year

Chart of year Kreppendorf / Zenn
Discharge from 03.06.2020 to 02.06.2021
- HQ1 23 m³/s
- HQ2 36 m³/s
- HQ5 49 m³/s
- HQ10 63 m³/s
- HQ20 77 m³/s
- HQ50 98 m³/s
- HQ100 115 m³/s
| Date | Mean value [m³/s] | Maximum [m³/s] | Minimum [m³/s] |
|---|---|---|---|
| 02.06.2021 | 0.482 | 0.569 | 0.398 |
| 01.06.2021 | 0.53 | 0.626 | 0.49 |
| 31.05.2021 | 0.533 | 0.57 | 0.491 |
| 30.05.2021 | 0.567 | 0.627 | 0.517 |
| 29.05.2021 | 0.609 | 0.657 | 0.543 |
| 28.05.2021 | 0.694 | 0.78 | 0.599 |
| 27.05.2021 | 0.68 | 0.78 | 0.599 |
© Bayerisches Landesamt für Umwelt 2024