

Chart of total period Kemmern / Main
Discharge from 01.11.1930 to 19.04.2024
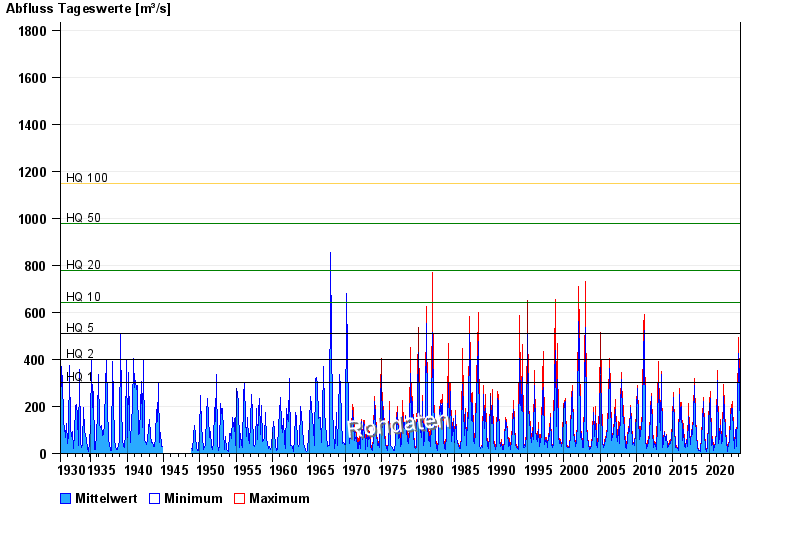
- HQ1 300 m³/s
- HQ2 400 m³/s
- HQ5 510 m³/s
- HQ10 640 m³/s
- HQ20 780 m³/s
- HQ50 980 m³/s
- HQ100 1150 m³/s
| Date | Mean value [m³/s] | Maximum [m³/s] | Minimum [m³/s] |
|---|---|---|---|
| 19.04.2024 | 37 | 37.7 | 35.9 |
| 18.04.2024 | 38.7 | 39.4 | 37.7 |
| 17.04.2024 | 35.3 | 38.3 | 32.6 |
| 16.04.2024 | 31.4 | 32.6 | 30.9 |
| 15.04.2024 | 31.8 | 32 | 31.5 |
| 14.04.2024 | 32.7 | 33.6 | 32 |
| 13.04.2024 | 34.5 | 35.3 | 33.6 |
© Bayerisches Landesamt für Umwelt 2024